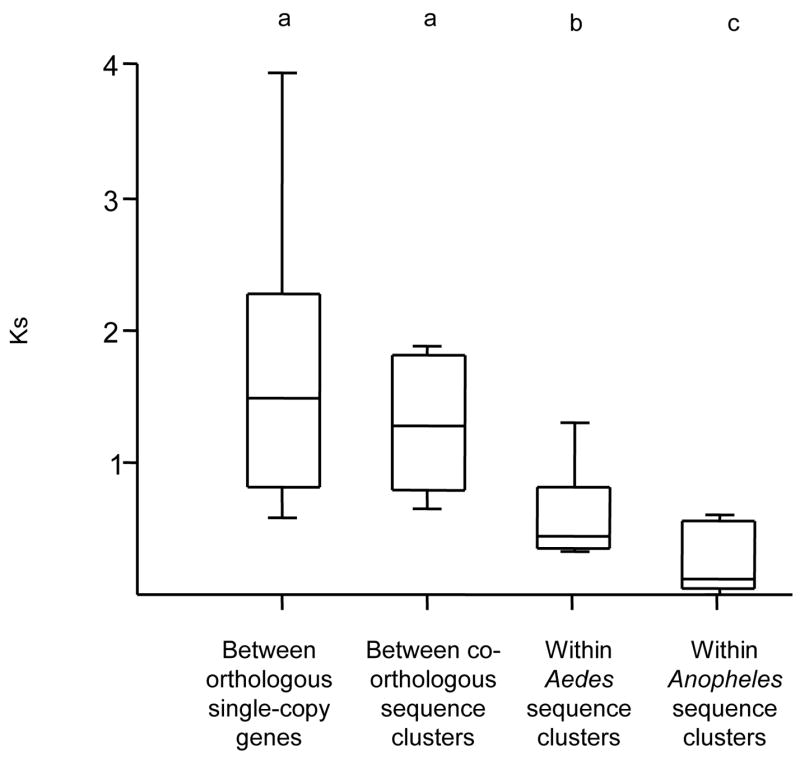
Fig. 6.

Box-plots of synonymous polymorphism (Ks) within the coding sequence of CPR genes of An. gambiae and Ae. aegypti. Each box represents the 25%–75% range, with the minimum, maximum, and median values represented by horizontal lines. For sequence clusters (see text for details), the mean Ks was calculated from all pairwise comparisons. Letters represent groups that are significantly different (P < 0.01) by ANOVA.
