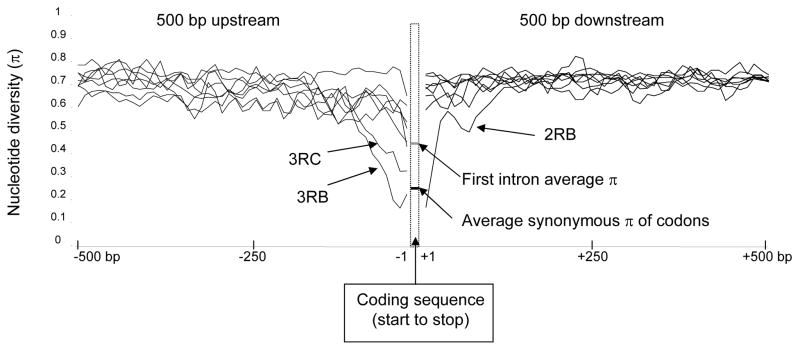
Fig. 7.
Average nucleotide diversity (π) of aligned PEST genomic sequence 500 bp 5′ and 3′ of genes in sequence clusters. The dashed box represents the gap associated with the coding sequence, and average values of π for synonymous sites in codons (black line) and first introns (gray line) are shown. Lines to the left and right of the box represent nucleotide diversity of flanking regions for each sequence cluster. Only the 5′ regions associated with sequence clusters 3RB and 3RC, which are discussed in the text, are indicated. The outlier in the 3′ region is sequence cluster 2RB, as indicated on the figure. Nucleotide diversity was calculated with DnaSP (Rozas et al., 2003) from ClustalW-aligned nucleotide sequence with default nucleotide gap penalties.

