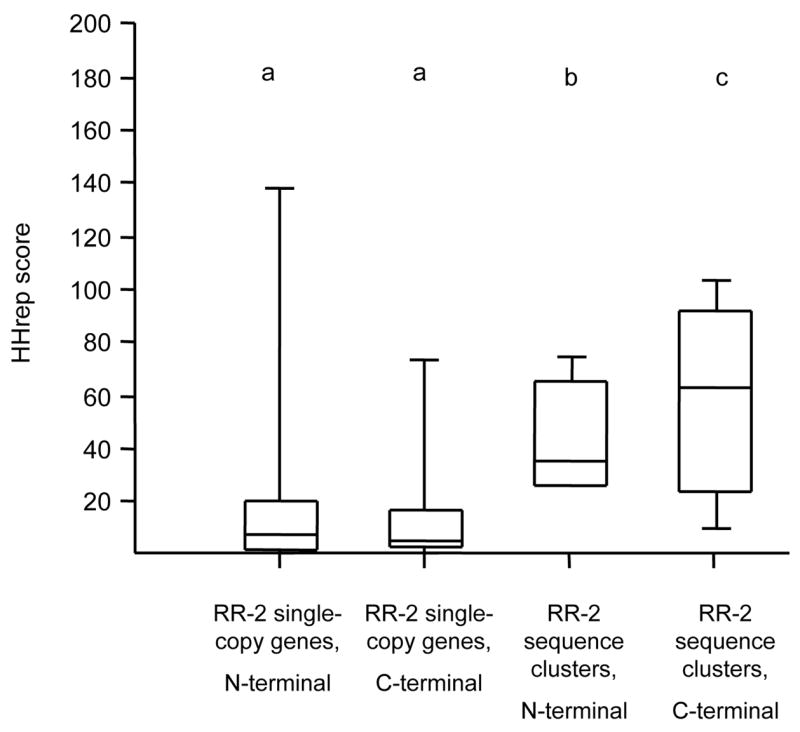
Fig. 8.

Box-plots of the distribution of scores representing the extent of repetitive amino-acid sequence in An. gambiae. Repetitive sequence scores were calculated with the HHrep tool (Söding et al., 2006). Each box represents the 25%–75% range, with the minimum, maximum, and median values represented by horizontal lines. Scores were calculated for single-copy and sequence-cluster RR-2 proteins separately (see text for details). The aminoacid sequence N-terminal and C-terminal to the Consensus was examined separately because different repeats are found within the two regions of the same protein. Letters indicate statistically significant differences in mean score (P < 0.01) by ANOVA of log-transformed data.
