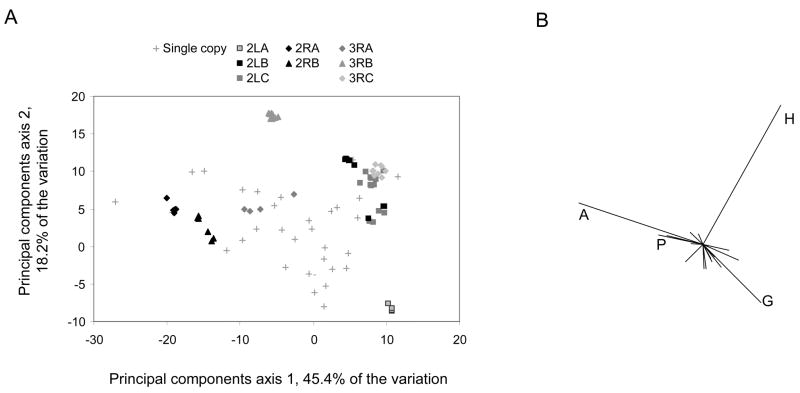
Fig. 9.
An. gambiae RR-2 proteins in sequence clusters (see text for details) have more extreme amino-acid compositions than do single-copy RR-2 proteins. (A) Scatterplot of An. gambiae RR-2 proteins based on their values for the first two principal components of the amino-acid composition matrix. Sequence clusters (see text for details) are marked according to the legend. The percentage of variation explained by each axis is also stated. (B) Vector representation of the contribution of the original amino acids to the distribution of points in the scatterplot, with four major amino acids labelled.

