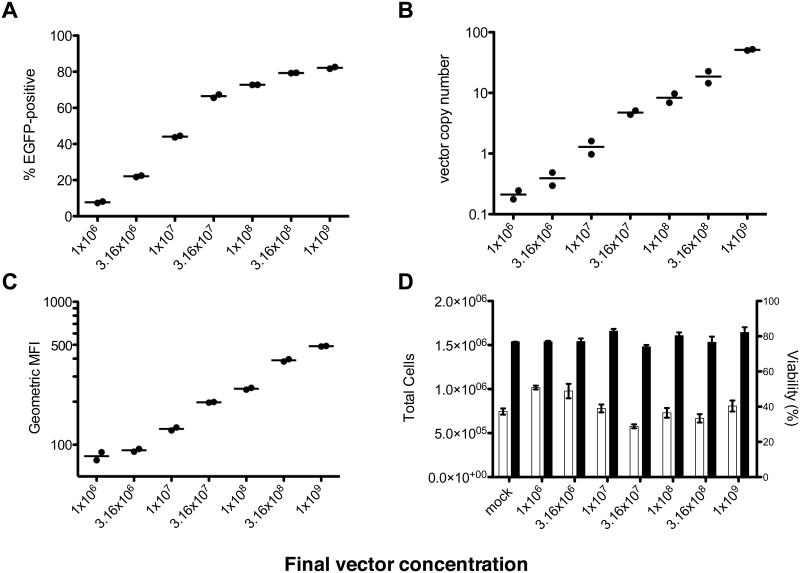
Figure 4.
Various metrics of transduction of CD34+ cells analyzed 7 days post-transduction, plotted against vector dose. (A) % EGFP+ cells by flow cytometry. (B) Vector copy number measured by real-time PCR. (C) Geometric mean fluorescence intensity of EGFP+ cells in each condition. (D) Cell count (□) and viability (■) by trypan blue dye exclusion. Bars represent mean and error bars represent range (n=2).

