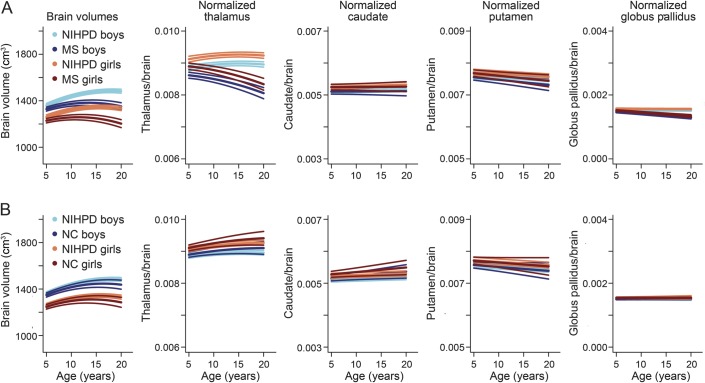
Figure 2. Estimated mean models.
Estimated mean models for NIH MRI Study of Normal Brain Development (NIHPD) and multiple sclerosis (MS) groups (A) and NIHPD and normally developing controls (NC) groups (B). For the normalized brain substructures, each graph has the same range to facilitate the comparison between graphs. The MS and NIHPD models were significantly different only for the brain, thalamus, and globus pallidus. The NC and NIHPD models were not significantly different.

