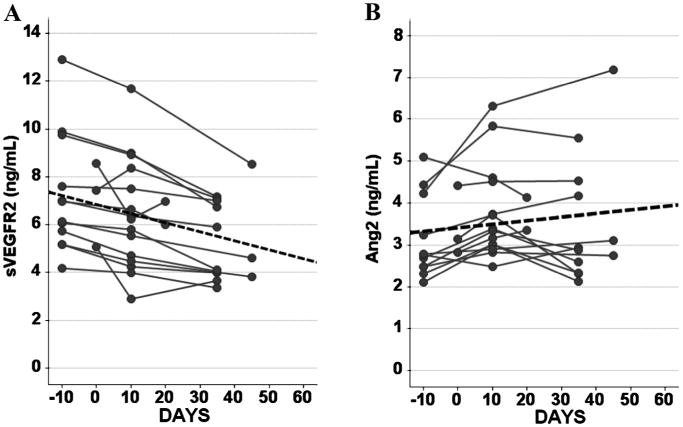
Figure 2.

Repeated measures linear modeling was used on (A) sVEGFR2 and (B) Ang2 concentrations, a test of the within subject change over time of exposure to sorafenib was performed using a Greenhouse-Geisser adjustment to derive the P-value (P ≤ 0.05 for both sVEGFR2 and Ang2). Dotted line indicates trend line in both A and B. sVEGFR2 concentrations clearly decline on exposure to sorafenib more than its regular fluctuation in healthy volunteers. Ang2 concentrations increased, but within its regular fluctuation found in healthy volunteers.
