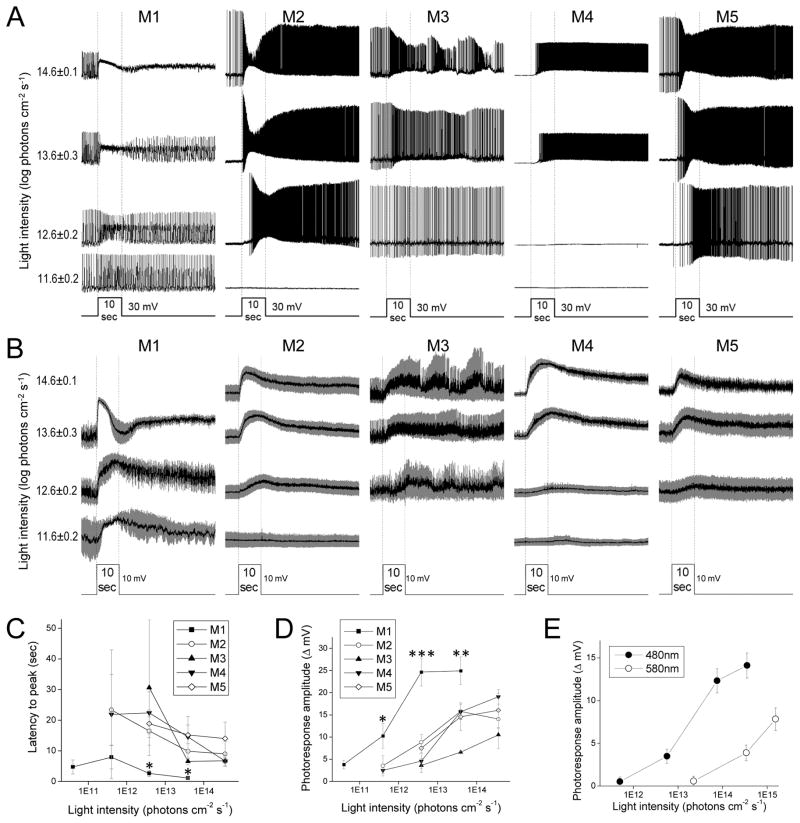
Figure 4. Intrinsic, melanopsin-mediated light responses.
A) Example intrinsic photoresponses of the five ipRGC types, evoked by 10-sec light steps. B) Averaged intrinsic light responses, with S.E.M. shown in gray. N values: M1, 3 – 6; M2, 3 – 9; M3, 2 – 3; M4, 3 – 7; M5, 8 – 10. C) Averaged latencies to peak. D) Averaged peak response amplitudes. The asterisks mark the M1 data that were significantly different from the other cell types’ data. E) To determine the λmax of the intrinsic light responses of M2 – M5 cells, their responses to 480 nm and 580 nm lights at several non-saturating intensities were measured. Shown are the averaged response amplitudes. λmax was calculated as described in Methods. N values: M2, 6; M3, 2; M4, 8; M5, 6.

