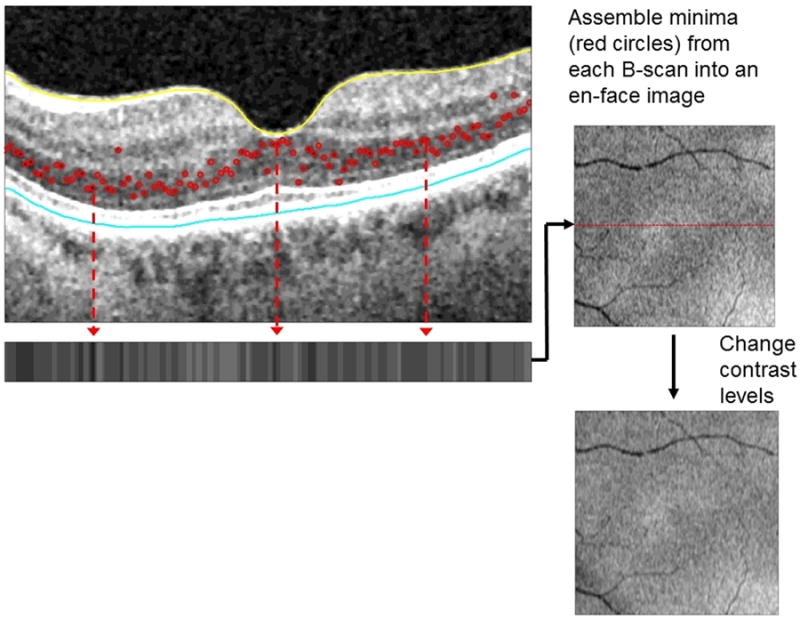
Figure 1.

In this MinIP OCT image of a healthy macula of a 77 year old woman, the minimum intensity signal along each B scan is detected (red circles) which are then represented on the horizontal strip below and used to generate an en face image. Note the lack of both black regions and bright white signal in this en face view of a normal macula.
