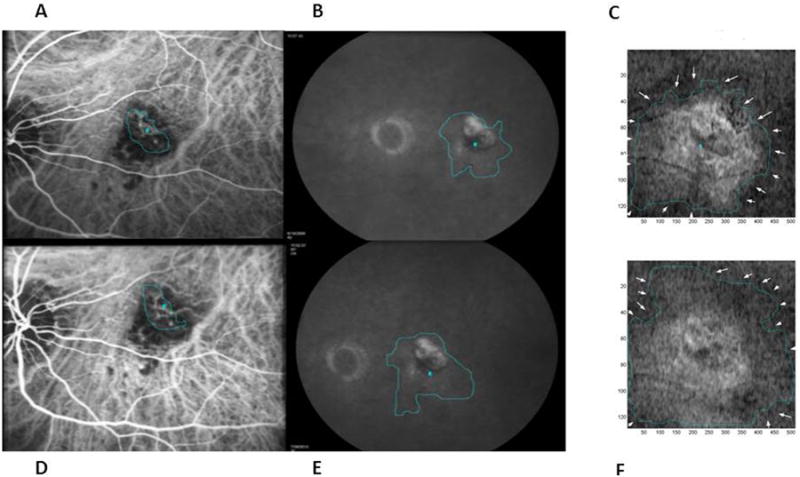
Figure 7.

An example of an eye in which the MinIP OCT lesion area (C-baseline and F-one year) was greatest at baseline followed by FA leakage area (B baseline and E one year) and then CNV area on ICG (A-baseline and D-one year) throughout the study period. This patient had persistent fluid requiring 10 injections during the one year. CNV area on ICG increased slightly by 2.1%. Note that the decreased black regions on MinIP OCT show some improvement in fluid status. However, the MinIP OCT lesion area enlarged by 16.6% at one year and had increased abnormal bright signal suggestive of a “penumbra” of retinal changes surrounding the CNV area.
