Abstract
TRAIL has been shown to induce apoptosis in cancer cells, but in some cases certain cancer cells are resistant to this ligand. In this study, we explored the ability of representative HSP90 (heat shock protein 90) inhibitor NVP-AUY922 to overcome TRAIL resistance by increasing apoptosis in colorectal cancer (CRC) cells. The combination of TRAIL and NVP-AUY922 induced synergistic cytotoxicity and apoptosis, which was mediated through an increase in caspase activation. The treatment of NVP-AUY922 dephosphorylated JAK2 and STAT3 and decreased Mcl-1 which resulted in facilitating cytochrome c release. NVP-AUY922-mediated inhibition of JAK2/STAT3 signaling and down-regulation of their target gene, Mcl-1, occurred in a dose and time-dependent manner. Knock down of Mcl-1, STAT3 inhibitor or JAK2 inhibitor synergistically enhanced TRAIL-induced apoptosis. Taken together, our results suggest the involvement of the JAK2-STAT3-Mcl-1 signal transduction pathway in response to NVP-AUY922 treatment, which may play a key role in NVP-AUY922-mediated sensitization to TRAIL. In contrast, the effect of the combination treatments in non-transformed colon cells was minimal. We provide a clinical rationale that combining HSP90 inhibitor with TRAIL enhances therapeutic efficacy without increasing normal tissue toxicity in CRC patients.
Keywords: NVP-AUY922, tumor necrosis factor (TNF)-related apoptosis-inducing ligand (TRAIL), Heat shock protein 90 (HSP90), apoptosis
1. Introduction
Colorectal cancer (CRC) is the second leading cause of cancer-related death in the West [1]. The current standard treatment for patients with CRC is surgical resection followed by chemotherapy, e.g., the combination of 5-fluorouracil, oxaliplatin and irinotecan for those patients; however, resistance to chemotherapy remains a major problem in the treatment of this disease because continuous chemotherapy with or without a targeting drug inevitably induces toxicity to normal tissues [2-4]. Despite considerable advances in the treatment of CRC, substantial changes in treatment strategies are required to overcome these problems of drug resistance and toxicity.
TRAIL (tumor necrosis factor-related apoptosis-inducing ligand) is a member of the tumor necrosis factor (TNF) - α family, which induces apoptosis via the extrinsic cell death pathway in a variety of cancer cells, but it is non-toxic to normal tissue cells [5, 6]. A relatively high proportion of tumor cell lines tested to date have been found to be sensitive to the cytotoxic effects of TRAIL, and there is evidence for the safety and potential efficacy of TRAIL therapy [4, 7]. Recently, some groups have reported that combinations of TRAIL and potential chemotherapeutic agents can increase TRAIL-induced apoptosis in several types of solid tumor cells [8-12].
Heat shock protein (HSP90) functions as a molecular chaperone of oncoproteins, by which it regulates cellular homeostasis, cell survival and transcriptional regulation [13, 14]. Unlike normal cells, HSP90 in cancer cells is frequently up-regulated upon exposure to various types of stress, e.g., acidosis, low oxygen tension, or nutrient deprivation [15]. Overexpression of HSP90 plays an important role in protection from therapeutic agent-induced apoptosis and signals a poor prognosis and malignancy [16-20]. By contrast, inhibition of HSP90 leads to the degradation of HSP90 client proteins, including oncogenic proteins, and consequently suppresses tumor growth and eventually causes cancer cells’ apoptosis. Over the past several years, the dozens of HSP90 inhibitors developed to treat cancer include geldanamycin (GA). However, the use of GA as a chemotherapeutic agent has not proceeded because it causes liver damage at effective concentrations. Then, second-generation HSP90 inhibitors have been developed, such as ganetespib and NVP-AUY922, which are considerably more powerful and less toxic. Recent strategy in treatment for cancer patients is combination therapies in which HSP90 inhibitors are combined with other chemotherapeutic agents [21-26]. In this study, we investigated whether NVP-AUY922 can enhance sensitivity to TRAIL in CRC cells by modulating antiapoptotic signaling pathway.
In earlier reports, combinations of HSP90 inhibitor and TRAIL were found to demonstrate synergistic activity against leukemia and glioma cells [27, 28]. In this study, we studied the novel HSP90 inhibitor, NVP-AUY922, in combination with TRAIL in CRCs. Our aims were to explore the ability of NVP-AUY922 to reverse resistance or increase sensitivity to TRAIL-induced apoptosis. We demonstrated that combinations of TRAIL and NVP-AUY922 are synergistic and induce increased apoptosis in CRCs with the simultaneous inhibition of the JAK2-STAT3-Mcl-1 signaling pathway. In contrast, this effect is minimal in non-transformed FHC human colon epithelial cells, indicating the potential for differential therapeutic selectivity. Our results indicate the therapeutic potential of combinatorial therapy TRAIL with HSP90 inhibitors in CRCs.
2. Materials and Methods
2.1. Cell culture
Human cancer HCT116, Caco-2, SW480, HT-29 and LS174T cells were purchased from American Tissue Type Culture Collection (ATCC) (Manassas, VA, USA). Human colorectal carcinoma CX-1 cells were obtained from Dr. JM Jessup (National Cancer Institute). Human colon cancer stem cells, Tu-12, were established by Dr. E. Lagasse (University of Pittsburgh). Cells were cultured in McCoy’s 5A, DMEM and RPMI 1640 medium (Invitrogen, Carlsbad, CA, USA) with 10% fetal bovine serum (HyClone, Logan, UT, USA), 1 mM L-glutamine, and 26 mM sodium bicarbonate for monolayer cell culture. Primary cultures of human normal colon cells (FHC) and their corresponding growth medium (DMEM:F12) were purchased from ATCC (Manassas, VA, USA). The dishes containing cells were kept in a 37°C humidified incubator with 5% CO2.
2.2. Reagents and antibodies
NVP-AUY922 and S31-201 were purchased from Selleck Chemicals (Houston, TX, USA). Niclosamide (5-chloro-N-(2-chloro-4-nitrophenyl)-2-hydroxybenzamide) and LLL12 (5-hydroxy-9,10-dioxo-9,10-dihydroanthracene-1-sulfonamide) were purchased from Biovision (Milpitas, CA, USA). Treatments of drugs were accomplished by aspirating the medium and replacing it with medium containing these drugs. For production of TRAIL, a human TRAIL cDNA fragment (amino acids 114–281) obtained by RT-PCR was cloned into a pET-23d (Novagen, Madison, WI, USA) plasmid, and His-tagged TRAIL protein was purified using the Qiagen express protein purification system (Qiagen, Valencia, CA, USA). Interleukin-6 (IL-6) growth factor was purchased from R&D Systems (Plymouth Meeting, PA, USA). Anti-Bax, anti-Bcl-2, and anti-Bcl-xL were purchased from Santa Cruz Biotechnology (Santa Cruz, CA, USA). Anti-XIAP, anti-cIAP1, anti-cIAP2, anti-Bid, anti-Mcl-1, anti-cleaved caspase-3, anti-cleaved caspase-8, anti-cleaved caspase-9, anti-His tag, anti-phospho JAK2, anti-JAK2, anti-phospho STAT3, anti-STAT3, and anti-PARP-1 were purchased from Cell Signaling (Beverly, MA, USA). Anti-cytochrome c antibody from PharMingen (San Diego, CA, USA) and anti-actin antibody was purchased from MP Biomedicals (Solon, OH, USA). For the secondary antibodies, anti-mouse-IgG-HRP and anti-rabbit-IgG-HRP were purchased from Santa Cruz Biotechnology.
2.3. Western blotting
Western blotting was carried out as previously described [12]. Immunoreactive proteins were visualized by the chemiluminescence protocol (ECL, Amersham, Arlington Heights, IL, USA). ImageJ software (NIH) was used for quantification of intensities of western blot bands.
2.4. Transient and stable transfection
JAK2 expression plasmids (pcDNA3.1-JAK2-HA and pcDNA3.1-JAK2(V617F)-HA) were kindly provided by Dr. Lily-shen Huang (University of Texas Southwestern Medical Center, Dallas, TX, USA). To evaluate the effect of Mcl-1 overexpression on its own antiapoptotic activity, we established HCT116-derived cell lines. Cells were transfected with human Mcl-1 tagged with His in pCDNA3.1 vector or the corresponding empty vector (pCDNA). Cells were selected with 1 mg/ml G418 for 2 weeks and five clones were pooled and then maintained in 500 μg/ml G418.
2.5. Small interfering RNA (siRNA)
STAT3 siRNA (Cat. No. SC-29493), Mcl-1 siRNA (Cat. No. SC-35877), and negative control siRNA (Cat. No. SC-37007) were obtained from SantaCruz Biotechnology. Cells were transfected with siRNA oligonucleotides using LipofectAMINE RNAi Max reagents (Invitrogen) according to the manufacturer’s introductions. After 24 hours of transfection, cells were treated with TRAIL for further analysis.
2.6. Real-time reverse transcription PCR
Total RNA was isolated from untreated or drug-treated cells using the RNAeasy Kit (Qiagen) according to the manufacturer’s protocol. Total RNA (2 μg) was used to generate complementary DNA using SuperScript III reverse transcriptase (Invitrogen). The following primers were used for Mcl-1: Forward: 5′-GACCGGCTCCAAGGACTC-3′, Reverse: 5′-TGTCCAGTTTCCGGAGCAT-3′, β-Actin: Forward: 5′-GACCTCACAGACTACCTCAT-3′, Reverse: 5′-AGACAGCACTGTGTTGGCTA-3′. Amplification and data collection were performed in accordance with the manufacturer’s instructions (Applied Biosystems 7500 real-time PCR system). The relative Mcl-1 expression levels were calculated using actin as an internal reference, and normalized to Mcl-1 expression in non-treated cells. All experiments were performed in duplicate.
2.7. Survival assay
MTS studies were carried out using the Promega CellTiter 96 AQueous One Solution Cell Proliferation Assay (Promega). Cells were grown in tissue culture-coated 96-well plates and treated as described in Results. Cells were then treated with MTS/phenazine methosulfate solution for 2 h at 37°C. Absorbance at 490 nm was determined using an enzyme-linked immunosorbent assay plate reader.
2.8. Apoptosis assay
The translocation of phosphatidylserine, one of the markers of apoptosis, from the inner to the outer leaflet of plasma membrane was detected by binding of allophycocyanin (APC)-conjugated Annexin V. Briefly, HCT116 cells untreated or treated with NVP-AUY922, TRAIL, or a combination of the two agents were resuspended for 24 hr in the binding buffer provided in the Annexin V-FITC Detection Kit II (BD Biosciences Pharmingen, San Diego, CA, USA). Cells were mixed with 5 μL Annexin V-FITC reagent and incubated for 30 min at room temperature in the dark. The staining was terminated and cells were immediately analyzed by flow cytometry.
2.9. Cytochrome c release assay
To determine the release of cytochrome c from the mitochondria, HCT116 cells growing in 100 mm dishes were used. After drug treatment, mitochondrial and cytosol fractions were prepared by using Mitochondrial Fractionation Kit (Active Motif, Carlsbad, CA, USA) from treated cells following company instructions and reagents included in the kit. Cytosolic fractions were subjected to SDS-PAGE gel electrophoresis and analyzed by immunoblotting using anti-cytochrome c antibody. Equal loading of the mitochondrial pellets was confirmed with anti-COX IV antibody.
2.10. Caspase-3/7 assay
Caspase 3/7 activities were measured on untreated and drug-treated cells using the caspase Glo-3/7 assay kit (Promega). Briefly, 5 × 10³ cells were plated in a white-walled 96-well plate, and the Z-DEVD reagent, the luminogenic caspase 3/7 substrate containing a tetrapeptide Asp-Glu-Val-Asp, was added in a 1:1 ratio of reagent to sample. After 60 min at room temperature, the substrate cleavage by activated caspase-3 and -7 was measured by determining the intensity of the luminescent signal using a Fusion-α plate reader (Perkin-Elmer). Differences in caspase-3/7 activity in drug-treated cells compared with untreated cells are expressed as fold-change in luminescence.
2.11. Statistical analysis
Statistical analysis was carried out using Graphpad Prism6 software (GraphPad Software, Inc., San Diego, CA, USA). The results were expressed as the mean of arbitrary values ± SEM. All results were evaluated using an unpaired Student’s t test, where a p-value of less than 0.05 was considered significant.
3. Results
3.1. Combined treatment with NVP-AUY922 and TRAIL synergistically induces cytotoxicity in CRC cells, but not normal colon cells
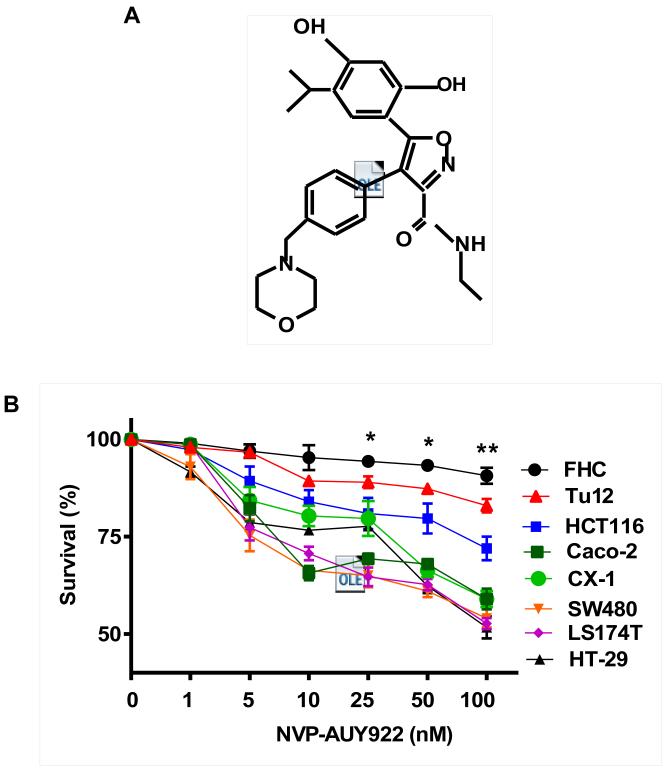
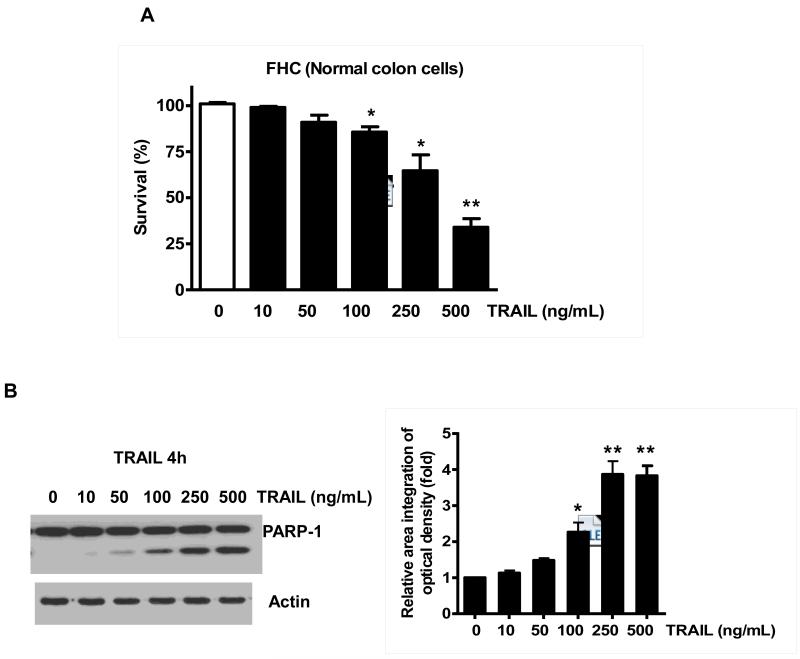
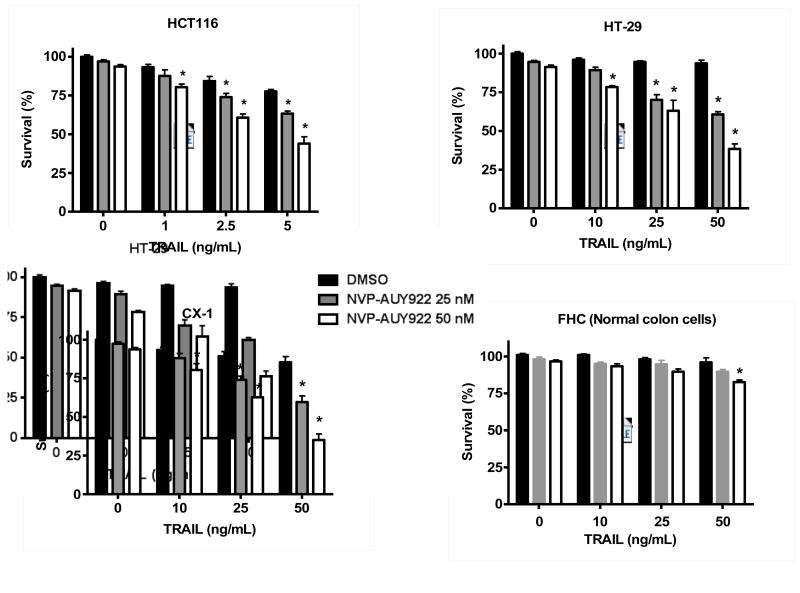
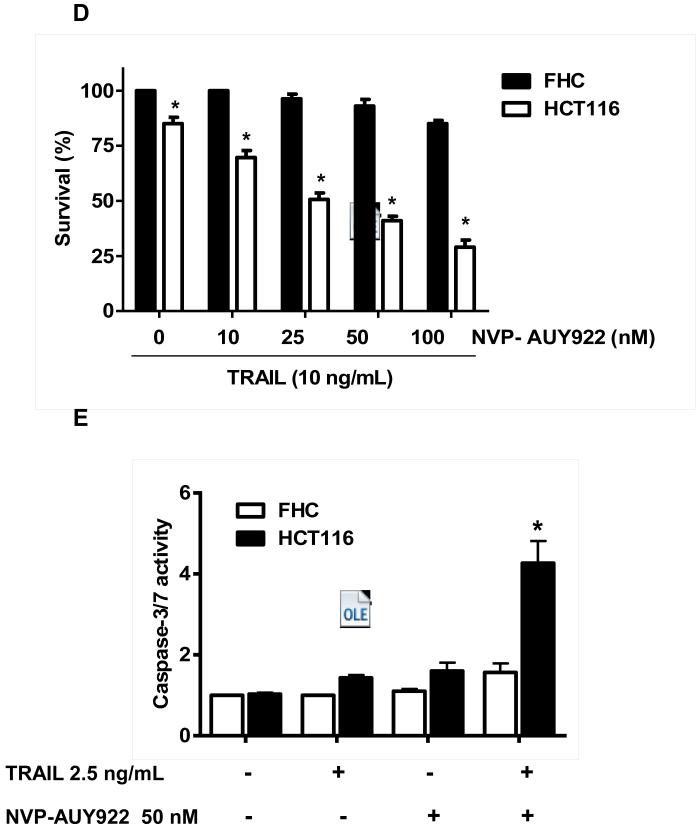
Previously, NVP-AUY922 has been reported to induce apoptosis of several cell types such as human oral squamous carcinoma cells, human melanoma cells, human neuroendocrine cancer cells, human prostate cancer cells, and human colorectal carcinoma cells [29-33]. Prior to investigating the effect of combined treatment with NVP-AUY922 (Fig. 1A) and TRAIL on cell viability in CRC cells, we examined whether NVP-AUY922 alone induces cytotoxicity. Cells were treated with various concentrations (10-100 nM) of NVP-AUY922 for 20 hr. As shown in Fig 1B, NVP-AUY922 induced cytotoxicity in a dose-dependent manner. Drug sensitivity varied among cancer cell lines but normal FHC colon cells were resistant to the drug. There was a minimal cytotoxicity (9% killing) at high dose (100 nM) of NVP-AUY922 in FHC, while the cancer cells displayed sensitivity even at 5 nM (Fig. 1B). Next, we investigated the effect of combined treatment with NVP-AUY922 and TRAIL on several CRC cell lines as well as FHC cells. TRAIL alone induced cytotoxicity in a dose-dependent manner in FHC cells (Fig. 2A). TRAIL-induced cytotoxicity was associated with apoptosis as shown by PARP-1 cleavage, the hallmark feature of apoptosis (Fig. 2B). Similar results were observed in CRC cell lines (data not shown). Combined treatment with NVP-AUY922 and TRAIL significantly enhanced cytotoxicity in TRAIL-sensitive HCT116 cells as well as TRAIL-resistant HT29 and CX-1 cells, but not FHC cells (Figs. 2C and 2D). These results suggest that the sensitizing regimen of NVP-AUY922 plus TRAIL may be preferentially toxic to CRC cells. The combinatorial treatment-enhanced cytotoxicity was probably due to an increase in caspase 3/7 activity (Fig. 2E).
Fig. 1. NVP-AUY922 induces cytotoxicity in human colon cancer cells.
(A) The structure of NVP-AUY922. (B) Cells were treated with various concentrations of NVP-AUY922 (1–100 nM) for 20 hr before being subject to the MTS assay. Error bars represent standard error of the mean (SEM) from three separate experiments. Some error bars are too small to be seen. Asterisk * or ** represents a statistically significant difference between FHC and cancer cells at p<0.05 or p<0.01, respectively.
Fig. 2. NVP-AUY922 markedly sensitizes various human colon cancer cells, but not normal colon cells, to TRAIL-induced apoptosis.
(A and B) FHC cells were treated with various concentrations (1-500 ng/ml) of TRAIL for 4 hr. (A) Cytotoxic effect of TRAIL was determined using the MTS assay. Error bars represent standard error of the mean (SEM) from three separate experiments. Asterisk * or ** represents a statistically significant difference between TRAIL treated FTC cells and untreated FTC cells at p<0.05 or p<0.01, respectively. (B) Equal amounts of protein (20 μg) from cell lysates were separated by SDS-PAGE and immunoblotted with anti-PARP-1. Actin was shown as an internal standard. Densitometry analysis of the bands from the cleaved form of PARP-1 was performed (right panel). Error bars represent standard error of the mean (SEM) from three separate experiments. Asterisk * or ** represents a statistically significant difference between TRAIL treated FTC cells and untreated FTC cells at p<0.05 or p<0.01, respectively. (C) Three different human colon cancer cells (HCT116, HT-29 and CX-1) and normal colon FHC cells were untreated or pretreated with NVP-AUY922 for 20 hr and then treated with TRAIL for 4 hr at the indicated concentration. Cellular viability was assessed using MTS assay. Error bars represent standard error of the mean (SEM) from three separate experiments. Asterisk * represents a statistically significant difference between NVP-AUY922 treated cells and untreated cells at p<0.05. (D) HCT116 and FHC cells were treated with various concentrations (0-100 nM) of NVP-AUY922 for 20 hr, and then added TRAIL for 4 hr. Cellular viability was assessed using MTS assay. Error bars represent standard error of the mean (SEM) from three separate experiments. Asterisk * represents a statistically significant difference between FHC cells and HCT116 cells at p<0.05. (E) HCT116 cells treated with 50 nM NVP-AUY922 alone (24 hr), 2.5 ng/ml TRAIL alone (4 hr), or NVP-AUY922 (20 hr) + TRAIL (4 h) for 24 h. Relative caspase activity was determined by the manufacturer’s protocol. Columns indicate average of three individual experiments; bars represents ±SD; *p < 0.05, compared with TRAIL-treated cells.
3.2. NVP-AUY922 potentiates TRAIL-mediated apoptosis via the activation of caspases
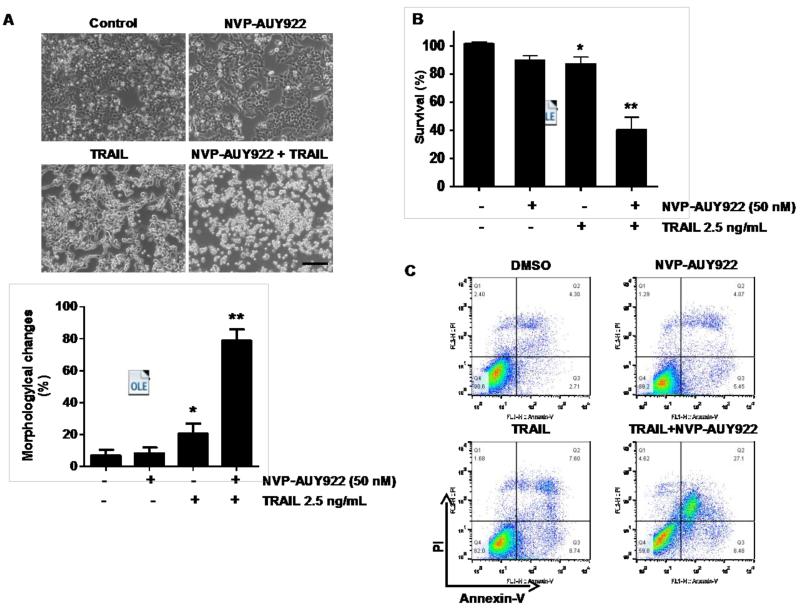
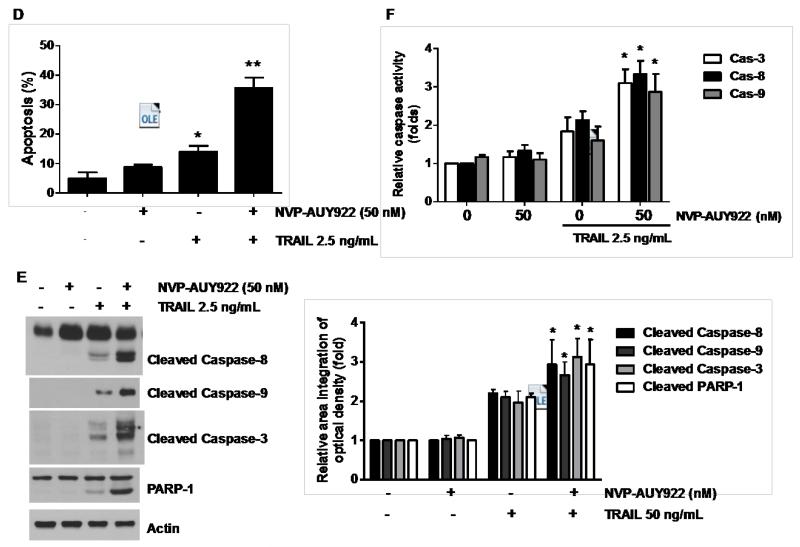
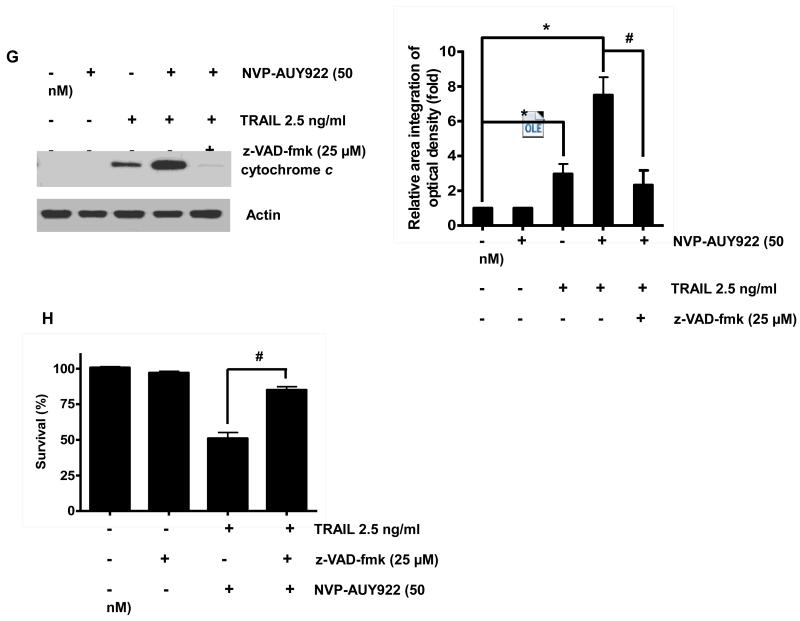
We further examined the mechanism of synergistic interaction between NVP-AUY922 and TRAIL. First, we examined and photographed the effect of 50 nM NVP-AUY922 in combination with 2.5 ng/ml TRAIL on HCT116 cell morphology under a light microscope (Fig. 3A). Observations made under the microscope showed that, after application of TRAIL or NVP-AUY922 in combination with TRAIL, the shape of the cells significantly changed in comparison to control cells or NVP-VUY922 only treated cells (Fig. 3A). Apoptotic cell death, which is associated with typical morphological features like cell shrinkage and cytoplasmic membrane blebbing, was observed. Morphologically changed cells were counted and statistical significance was analyzed (Fig. 3A). We further examined the effect of NVP-AUY922 on TRAIL-induced cytotoxicity by using MTS assay. Figure 3B shows that combined treatment with NVP-AUY922 and TRAIL synergistically induced cytotoxicity in comparison to NVP-AUY922 or TRAIL alone. To clarify whether the effect of NVP-AUY922 on TRAIL-induced cytotoxicity is associated with apoptosis, we employed the Annexin V assay (Fig. 3C), PARP-1 cleavage assay (Fig. 3E), and cleavage of caspase 8/9/3 (Fig. 3E) and their activities assay (Fig. 3F). Data from flow cytometric assay clearly show that TRAIL induced apoptosis and NVP-AUY922 enhanced TRAIL-induced apoptosis (Figs. 3C and 3D). Data from biochemical analysis show that NVP-AUY922 substantially promoted TRAIL-induced activation of caspases-3, -8 and -9, which led to an increase in PARP cleavage in HCT116 cells (Figs. 3E and 3F). Combined treatment with NVP-AUY922 and TRAIL markedly enhanced cytochrome c release and pretreatment with pan-caspase inhibitor z-VAD-fmk significantly attenuated TRAIL + NVP-AUY922-induced cytochrome c release from the mitochondria into the cytosol (Fig. 3G) and TRAIL + NVP-AUY922-induced cytotoxicity (Fig. 3H). These results suggest that the combinatorial treatment-enhanced apoptosis was mediated through an increase in caspase activation.
Fig. 3. Sensitizing effect of NVP-AUY922 on TRAIL-induced apoptosis in HCT116 cells.
(A-F) Cells were treated with DMSO (sham control), 50 nM NVP-AUY922 only for 24 hr, or 50 nM NVP-AUY922 only for 20 hr and then incubated in the presence or absence of TRAIL (2.5 ng/ml) for 4 hr. (A) Microscopic cell morphologies. Scale bar: 100 μm. Morphologically changed cells were counted and analyzed. Error bars represent standard error of the mean (SEM) from three separate experiments. Asterisk * or ** represents a statistically significant difference between treated cells and untreated control cells at p<0.05 or p<0.01, respectively. (B) Cellular viability was assessed using MTS assay. Error bars represent standard error of the mean (SEM) from three separate experiments. Asterisk * or ** represents a statistically significant difference between treated cells and untreated control cells at p<0.05 or p<0.01, respectively. (C and D) The cells were stained with annexin V and propidium iodide (PI), followed by FACS analysis. Error bars represent standard error of the mean (SEM) from three separate experiments. Asterisk * or ** represents a statistically significant difference between treated cells and untreated control cells at p<0.05 or p<0.01, respectively. (E) Lysates containing equal amounts of protein (20 μg) were separated by SDS–PAGE and immunoblotted with anti-PARP-1, anti-caspase-8, anti-caspase-9, or anti-caspase-3 antibody. Densitometry analysis of the bands from the cleaved forms of caspase-8, -9, -3 or PARP-1 was performed (right panel). Error bars represent standard error of the mean (SEM) from three separate experiments. Asterisk * represents a statistically significant difference between treated cells and untreated control cells at p<0.01. (F) Relative caspase activity was determined by the manufacturer’s protocol. Error bars represent standard error of the mean (SEM) from three separate experiments. Asterisk * represents a statistically significant difference between NVP-AUP922 + TRAIL treated cells and TRAIL alone treated cells at p<0.05. (G and H) Cells were pretreated with 25 μM z-VAD-fmk for 30 min and further treated with NVP-AUY922 (20 hr) + TRAIL (4 hr) for 24 hr. (G) Lysates from cytosolic fractions containing equal amounts of protein (20 μg) were separated by SDS–PAGE and immunoblotted with anti-cytochrome c antibody. Actin was used to confirm the equal amount of proteins loaded in each lane. Densitometry analysis of the bands from the cytochrome c was performed (right panel). Error bars represent standard error of the mean (SEM) from three separate experiments. Asterisk * represents a statistically significant difference between NVP-AUY922/TRAIL treated cells and untreated control cells at p<0.01. Hashtag # represents a statistically significant difference between z-VAD-fmk + NVP-AUY922 + TRAIL treated cells and NVP-AUY922 + TRAIL treated cells at p<0.01. (H) Cellular viability was assessed using an MTS assay. Error bars represent standard error of the mean (SEM) from three separate experiments. Hashtag # represents a statistically significant difference between z-VAD-fmk + NVP-AUY922 + TRAIL treated cells and NVP-AUY922 + TRAIL treated cells at p<0.01.
3.3. Anti-apoptotic protein Mcl-1 is important for the sensitizing effect of NVP-AUY922 in TRAIL-induced apoptosis of HCT116 cells
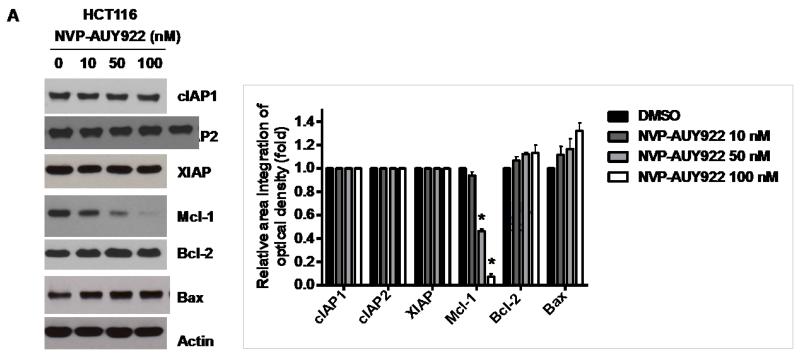
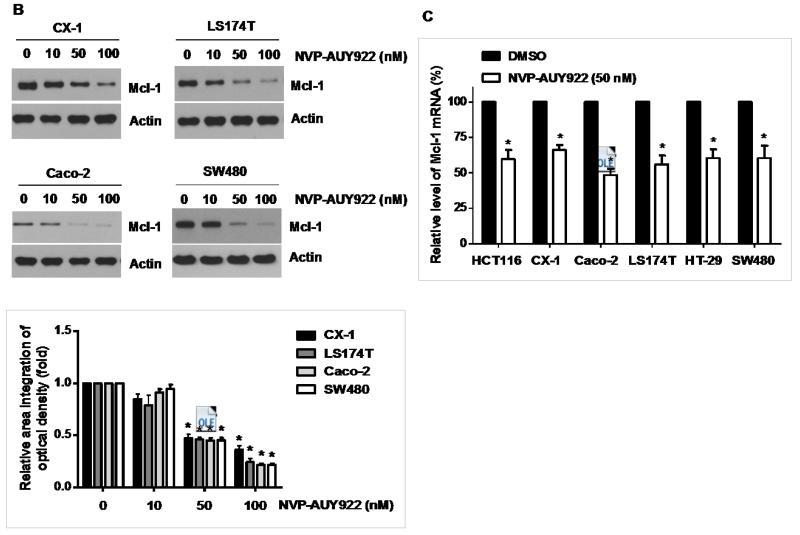
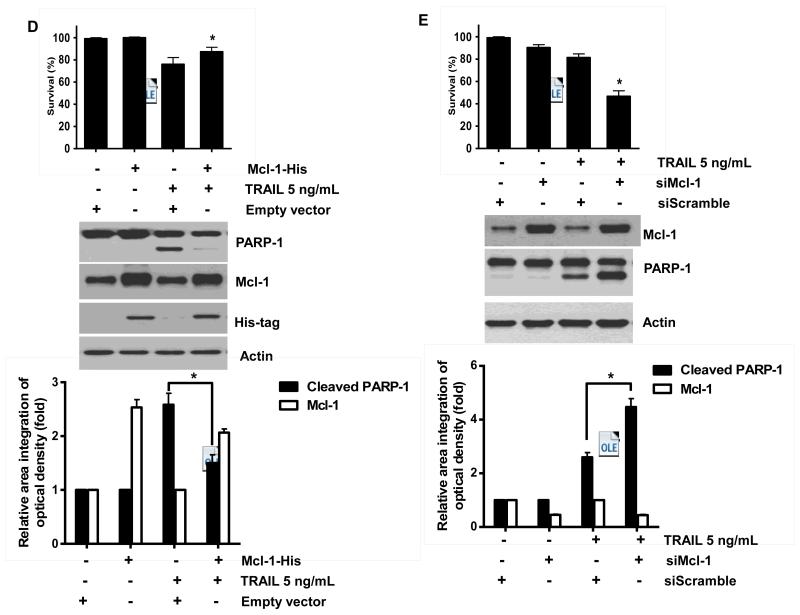
Binding of TRAIL to death receptors (DRs) has been known to lead to the activation of the apoptotic signaling pathway through cleavage of caspases and activation of pro-apoptotic proteins [34]. Therefore, we investigated whether NVP-AUY922 could affect the apoptotic pathway which transmits the sensitizing effect for apoptosis. As shown in Fig. 4A, there was no change during NVP-AUY922 treatment in caspase inhibitor protein family members such as c-IAP-1, c-IAP-2 and XIAP, and Bcl-2 family members such as Bcl-2 and Bax. The level of death receptors such as DR4 and DR5 was also not affected (Data not shown). However, unlike these proteins, Mcl-1 was down-regulated in a dose-dependent manner by NVP-AUY922 treatment in HCT 116 cells (Fig. 4A). Similar results were observed in CX-1, LS174T, Caco-2, and SW480 colon cancer cell lines (Fig. 4B). NVP-AUY922-induced down-regulation of Mcl-1 protein was probably due to the reduction of Mcl-1 mRNA in these cell lines (Fig. 4C). These results suggest that the sensitizing effect of NVP-AUY922 is exerted by down-regulating the expression of anti-apoptotic molecule Mcl-1 in CRC cells. We further investigated the role of Mcl-1 in the sensitizing effect of NVP-AUY922 on TRAIL-induced apoptosis by using recombinant DNA technology. HCT116 cells were stably transfected with expression vector containing Mcl-1 cDNA. As shown in Fig. 4D, NVP-AUY922 potentiated TRAIL-mediated apoptotic death in control cells. However, over-expression of Mcl-1 prevented the sensitizing effect of NVP-AUY922 on TRAIL-induced apoptosis. Furthermore, silencing of Mcl-1 by siRNA increased TRAIL-induced apoptosis (Fig. 4E). These data indicate that down-regulation of anti-apoptotic protein Mcl-1 by NVP-AUY922 is responsible for the sensitizing effect of NVP-AUY922 on TRAIL-induced apoptosis.
Fig. 4. Role of Mcl-1 in the sensitizing function of NVP-AUY922.
(A) HCT116 cells were treated with indicated NVP-AUY922 doses (0, 10, 50, 100 nM) for 20 hr. Western blotting analysis was done by using indicated antibodies (cIAP1, cIAP2, XIAP, Mcl-1, Bcl-2, and Bax). Densitometry analysis of the bands from each protein was performed (right panel). Error bars represent standard error of the mean (SEM) from three separate experiments. Asterisk * represents a statistically significant difference between NVP-AUY922 treated cells and untreated control cells at p<0.01. (B) CX-1, LS174T, Caco-2, and SW480 cells were treated with indicated NVP-AUY922 doses (0, 10, 50, 100 nM) for 20 hr. Cell lysates were analyzed by western blotting using anti-Mcl-1 antibody. Densitometry analysis of the bands from Mcl-1 was performed (lower panel). Error bars represent standard error of the mean (SEM) from three separate experiments. Asterisk * represents a statistically significant difference between NVP-AUY922 treated cells and untreated control cells at p<0.05. (C) Various colon cancer cells were treated with 50 nM NVP-AUY922 for 20 hr. Mcl-1 mRNA expression was determined by RT-PCR. Error bars represent standard error of the mean (SEM) from three separate experiments. Asterisk * represents a statistically significant difference between NVP-AUY922 treated cells and untreated control cells at p<0.05. (D) Empty vector (control) or Mcl-1 stably over-expressing HCT116 cells (lower panel) were treated with TRAIL for 4 hr. Survival was analyzed by MTS assay (upper panel). Densitometry analysis of the bands from cleaved PARP-1 or Mcl-1 was performed (lower panel). Error bars represent standard error of the mean (SEM) from three separate experiments. Asterisk * represents a statistically significant difference between TRAIL treated on empty vector transfected cells and TRAIL treated on Mcl-1-His vector transfected cells at p<0.05. (E) Mcl-1 was silenced by Mcl-1 siRNA in HCT116 cells (lower panel). The cells were then treated with TRAIL for 4 hr followed by MTS analysis (upper panel). Results shown are representative of three independent experiments. Densitometry analysis of the bands from cleaved PARP-1 or Mcl-1 was performed (lowest panel). Error bars represent standard error of the mean (SEM) from three separate experiments. Asterisk * represents a statistically significant difference between TRAIL + siScramble treated cells and TRAIL + siMcl-1 treated cells at p<0.05.
3.4. NVP-AUY922 potentiates TRAIL-induced apoptosis by inhibiting the Jak2-Stat3-Mcl-1 signal transduction pathway
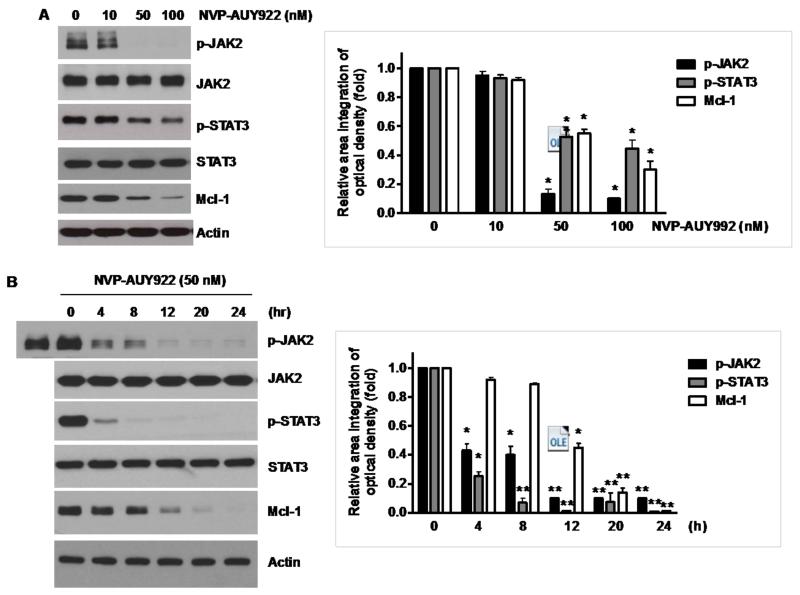
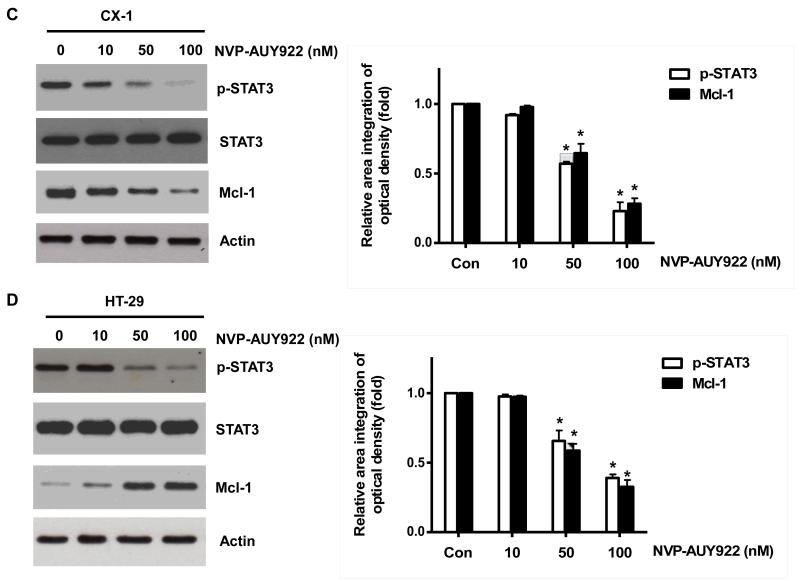
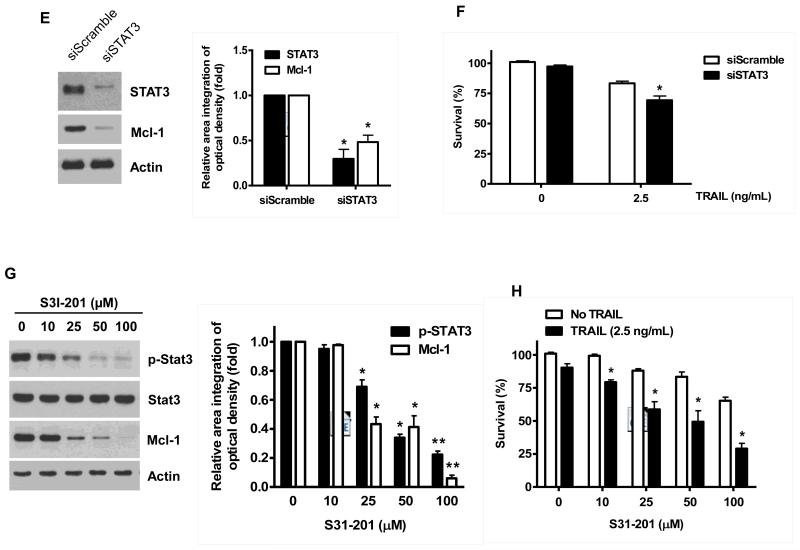
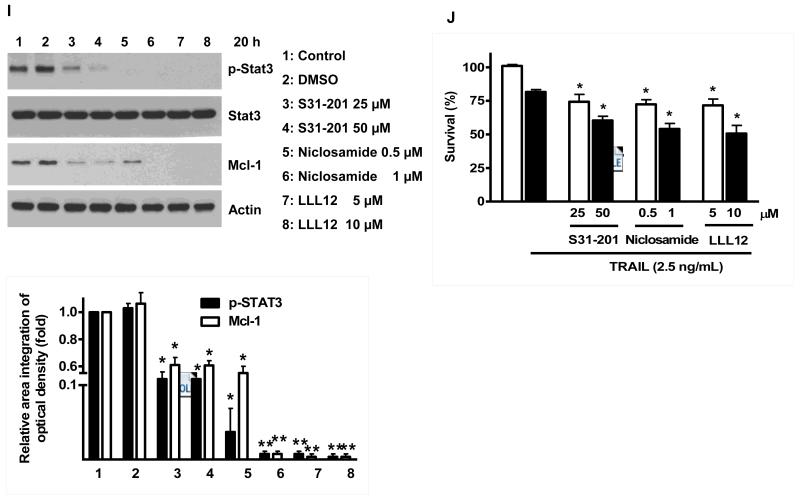
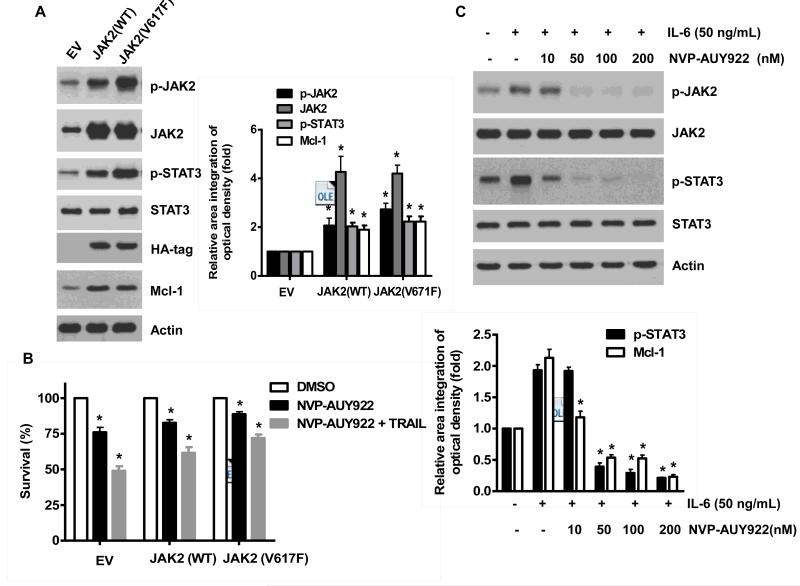
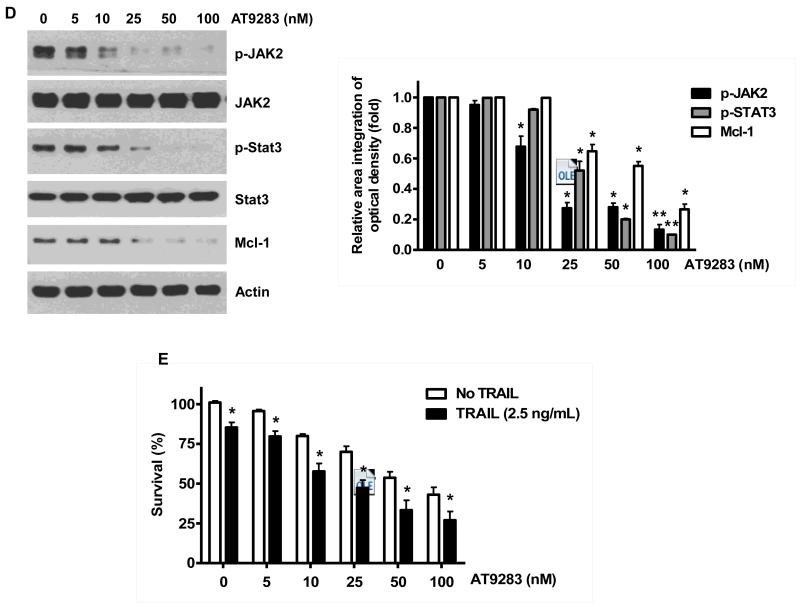
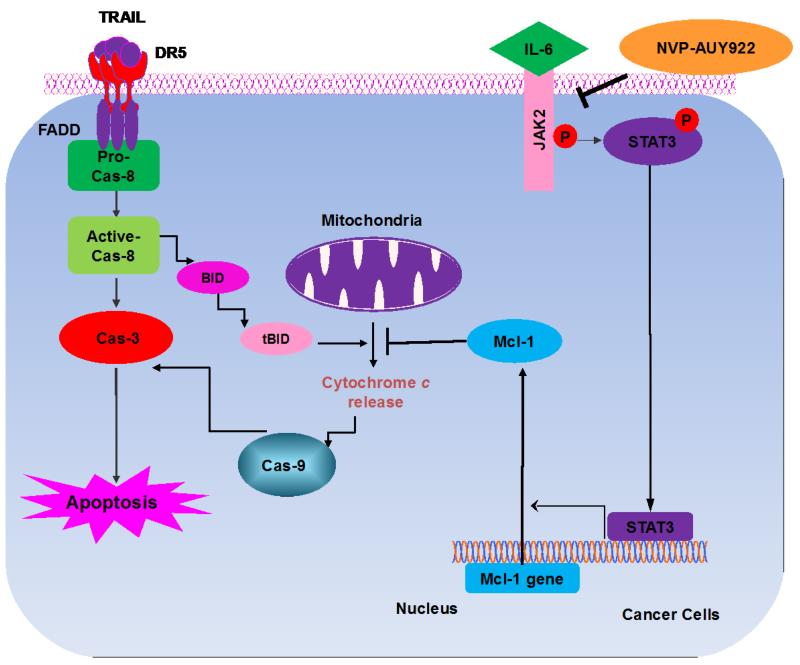
Once we observed that the combination of NVP-AUY922 with TRAIL synergistically enhances cell death by down-regulating Mcl-1, we further investigated the underlying mechanism. As shown in Figures 5A and 5B, NVP-AUY922 dephosphorylated (inactivated) STAT3 without altering the level of these proteins in dose- and time-dependent manner in HCT116 cells. Similar results were observed in CX-1 and HT-29 cells (Figs. 5C and 5D). Because the active form of STAT3 was inhibited, we further analyzed the upstream and downstream pathway of STAT3. STAT3 is phosphorylated at residue Tyr705 as well as Ser727. This phosphorylation is mediated by receptor-associated tyrosine kinases, such as JAKs [35, 36]. Indeed, NVP-AUY922 dephosphorylated JAK2 residue Tyr1007 and Tyr1008 (Fig. 5A). We also confirmed that Mcl-1, a downstream molecule of STAT3, was down-regulated in dose- and time-dependent manner in HCT116 cells (Figs. 5A and 5B). We further investigated the STAT3-Mcl-1 pathway by using STAT3 siRNA. As shown in Figure 5E, expression of STAT3 and Mcl-1 was reduced by STAT3 siRNA. Moreover, silencing STAT3 by siRNA made HCT116 cells more sensitive to TRAIL (Fig. 5F). We also investigated the STAT3-Mcl-1 pathway by using STAT3 inhibitors (S31-201, Niclosamide and LLL12). S31-201 inhibited activation of STAT3 and down-regulated Mcl-1 in a dose-dependent manner and enhanced TRAIL cytotoxicity (Figs. 5G and 5H). Similar results were observed by other STAT3 inhibitors (Niclosamide and LLL12) (Figs. 5I and 5J). Next, we examined the role of the JAK2-STAT3-Mcl-1 pathway in the mechanisms underlying NVP-AUY922-induced sensitization. HCT116 cells were stably transfected with pcDNA3.1 containing JAK2-WT or JAK2-V617F (a change of valine to phenylalanine at the 617 position; dominant-positive mutant) cDNA. Figure 6A shows that over-expression of JAK2-WT and JAK2-V617F increased phosphorylation of JAK2 and STAT3 and the level of Mcl-1. Over-expression of JAK2-WT and JAK2-V617F subsequently induced resistance to NVP-AUY922 + TRAIL treatment (Fig. 6B). Previous studies have shown that JAK2 is a non-receptor tyrosine kinase and that IL-6 exerts its effects through the JAK2-STAT3 signal transduction pathway [37]. We examined whether NVP-AUY922 can inhibit the IL-6 activated JAK2-STAT3 signal transduction pathway. Figure 6C shows that IL-6 activated JAK2 and STAT3, and NVP-AUP922 inhibited the IL-6-activated JAK2-STAT3 signal transduction pathway in a dose-dependent manner. We further investigated the JAK2-STAT3-Mcl-1 pathway by using JAK2 inhibitor AT9283. AT9283 inhibited activation of JAK2 and STAT3 and down-regulated Mcl-1 in a dose-dependent manner and enhanced TRAIL cytotoxicity (Figs. 6D and 6E). Taken together, NVP-AUY922 potentiates TRAIL-induced apoptosis by inhibiting the Jak2-Stat3-Mcl-1 signal transduction pathway (Fig. 7).
Fig. 5. Effects of NVP-AUY922 on the JAK2-STAT3-Mcl-1 pathway.
(A and B) (A) HCT116 cells were treated with indicated NVP-AUY922 doses (0, 10, 50, 100 nM) for 20 hr. Densitometry analysis of the bands from p-JAK2, p-STAT3 or Mcl-1 was performed (right panel). Error bars represent standard error of the mean (SEM) from three separate experiments. Asterisk * represents a statistically significant difference between NVP-AUY992 treated cells and untreated control cells at p<0.05. (B) HCT116 cells were treated with 50 nM NVP-AUY922 for various times (4-24 hr). Lysates containing equal amounts of protein (20 μg) were separated by SDS-PAGE and immunoblotted with anti-phospho-JAK2, anti-JAK2, anti-phospho-STAT3, anti-STAT3, or anti-Mcl-1 antibody. Actin was shown as an internal standard. Densitometry analysis of the bands from p-JAK2, p-STAT3 or Mcl-1 was performed (right panel). Error bars represent standard error of the mean (SEM) from three separate experiments. Asterisk * represents a statistically significant difference between NVP-AUY992 treated cells and untreated control cells at p<0.05. (C and D) CX-1 and HT-29 cells were treated with indicated NVP-AUY922 doses (0, 10, 50, 100 nM) for 20 hr followed by western blotting using anti-phospho-STAT3, anti-STAT3, or anti-Mcl-1 antibody (left panels). Actin was shown as an internal standard. Densitometry analysis of the bands from p-STAT3 or Mcl-1 was performed (right panels). Error bars represent standard error of the mean (SEM) from three separate experiments. Asterisk * represents a statistically significant difference between NVP-AUY992 treated cells and untreated control cells at p<0.05. (E and F) STAT3 was silenced by STAT3 siRNA in HCT116 cells. The cells were then treated with TRAIL for 4 hr followed by MTS analysis. Densitometry analysis of the bands from STAT3 or Mcl-1 was performed (right panel). Error bars represent standard error of the mean (SEM) from three separate experiments. Asterisk * represents a statistically significant difference between siSTAT3 treated cells and siControl treated cells at p<0.05. (G and H) HCT116 cells were treated with various concentrations of S31-201 (10, 25, 50, 100 μM) for 20 hr, and then added TRAIL for 4 hr. Lysates containing equal amounts of protein were separated by SDS-PAGE and immunoblotted with anti-phospho-STAT3, anti-STAT3, or anti-Mcl-1 antibody. Actin was shown as an internal standard. Three independent experiments were carried out and cellular viability was assessed using an MTS assay. Densitometry analysis of the bands from p-STAT3 or Mcl-1 was performed (right panel). Error bars represent standard error of the mean (SEM) from three separate experiments. Asterisk * or ** represents a statistically significant difference between treated cells and untreated control cells at p<0.05 or p<0.01, respectively. (I and J) HCT116 cells were treated with S31-201 (25, 50 μM), niclosamide (0.5, 1 μM) or LLL12 (5, 10 μM) for 20 hr, and then added TRAIL for 4 hr. Three independent experiments were carried out and cellular viability was assessed using an MTS assay. Densitometry analysis of the bands from p-STAT3 or Mcl-1 was performed (lower panel). Error bars represent standard error of the mean (SEM) from three separate experiments. Asterisk * represents a statistically significant difference between control and drug treated cells at p<0.05.
Fig. 6. NVP-AUY922 inhibits the IL-6-JAK2-STAT3-Mcl-1 pathway in HCT116 cells.
(A and B) Cells were transfected with empty vector (EV), HA-JAK2-WT or HA-JAK2-V617F. (A) Lysates containing equal amounts of protein were separated by SDS-PAGE and immunoblotted with anti-phospho-JAK2, anti-JAK2, anti-phospho-STAT3, anti-STAT3, anti-HA (exogenous JAK), or anti-Mcl-1 antibody. Actin was shown as an internal standard. Densitometry analysis of the bands from p-JAK2, JAK2, p-STAT3 or Mcl-1 was performed (right panel). Error bars represent standard error of the mean (SEM) from three separate experiments. Asterisk * represents a statistically significant difference between JAK2 WT or JAK2 V617F vector transfected cells and empty vector transfected cells at p<0.05. (B) Transfected cells were treated with TRAIL for 4 hr and cellular viability was assessed using an MTS assay. Error bars represent the mean + S.E from three separate experiments. Asterisk * represents a statistically significant difference between NVP-AUY922 or NVP-AUY922 + TRAIL treated cells and untreated control cells at p<0.05. (C) Cells were pretreated with 50 ng IL-6 for 30 min and further treated with NVP-AUY922 for 4 hr. Lysates containing equal amounts of protein were separated by SDS-PAGE and immunoblotted with anti-phospho-JAK2, anti-JAK2, anti-phospho-STAT3, or anti-STAT3 antibody. Actin was shown as an internal standard. Densitometry analysis of the bands from p-STAT3 or Mcl-1 was performed (lower panel). Error bars represent standard error of the mean (SEM) from three separate experiments. Asterisk * represents a statistically significant difference between IL-6 + NVP-AUY922 treated cells and IL-6 alone treated cells at p<0.05. ((D and E) Cells were treated with AT9283 (5, 10, 25, 50, 100 nM) for 20 hr, and then added TRAIL for 4 hr. (D) Lysates containing equal amounts of protein were separated by SDS-PAGE and immunoblotted with anti-phospho-JAK2, anti-JAK2, anti-phospho-STAT3, anti-STAT3, or anti-Mcl-1 antibody. Actin was shown as an internal standard. Densitometry analysis of the bands from p-JAK2, p-STAT3 or Mcl-1 was performed (right panel). Error bars represent standard error of the mean (SEM) from three separate experiments. Asterisk * represents a statistically significant difference between drug treated cells and untreated control cells at p<0.05. (E) Cellular viability was assessed using an MTS assay. Error bars represent the mean + S.E from three separate experiments. Asterisk * represents a statistically significant difference between control and drug treated cells at p<0.05.
Figure 7. Schematic diagram for working model of NVP-AUY922 sensitizing TRAIL-induced apoptosis.
4. Discussion
Although NVP-AUY922 has recently been shown to induce apoptosis in different types of solid tumors, we report here that low dose of NVP-AUY922 also effectively sensitizes CRC cells to TRAIL-induced apoptosis by increasing caspase activation which occurs at least in part by down-regulation of antiapoptotic protein Mcl-1. Our studies also suggest that the down-regulation of Mcl-1 is due to inhibition of the JAK2-STAT3 signal transduction pathway during treatment with NVP-AUY922.
The JAK-STAT3 signaling pathway can be activated by several cytokines including IL-6 [37-39]. IL-6-mediated activation of JAK-STAT3 signals is known to increase proliferation of CRC [37, 40]. In addition, our studies suggest that IL6-JAK-STAT3 signals may activate anti-apoptotic pathways. Therefore, modulation of the IL-6-JAK-STAT3 signaling pathway can be a novel strategy to treat CRC patients [41]. Our studies explain a possible mechanism and role of the IL-6-JAK2-STAT3 pathway in CRC and propose a novel therapeutic strategy to treat CRC.
During NVP-AUY922 treatment, dysfunction of HSP90 may lead to inactivity and degradation of client proteins, among which are key components of the JAK2 signaling pathway that includes STAT3 and Mcl-1. Abnormalities of the JAK-STAT pathway are reported to be involved in the pathogenesis of several solid tumors [42-44]. However, the molecular mechanism by which disrupted JAK2-STAT3 signaling contributes to apoptosis has not been clarified. Therefore, understanding the mechanisms of apoptosis during NVP-AUY922 treatment is crucial to comprehending the role of the JAK2-STAT3 pathway in cancer therapies. Recently Xiong et al. reported that inhibition of JAK2-STAT3 signaling induced apoptosis in CRC cells [45]. However, the exact mechanisms are still not well understood. Recent data demonstrated that STAT3 was highly activated in LGL leukemic cells, and inhibition of STAT3 by antisense oligonucleotides and AG490, a specific inhibitor of JAK2, resulted in down-regulation of Mcl-1 and apoptotic cell death [46]. Similar results were observed in Figure 6D. In this study, the role of the JAK2-STAT3 pathway in the regulation of Mcl-1 gene expression and TRAIL-induced apoptosis were observed by inhibiting JAK2 and STAT3 with NVP-AUY922 (Figs. 5A and 5B). As the result of our studies, we propose a novel combination treatment of biotherapeutic agent TRAIL and HSP90 inhibitor AUY922 on CRC. We believe that understanding the mechanisms involved in this combination treatment is important not only to predict and interpret the responses but also to enhance the efficacy of this combination.
In this study, we observed that NVP-AUY922 effectively down-regulates expression of the caspase-9 inhibitor Mcl-1. Furthermore, we showed that over-expression of Mcl-1 protects CRC from TRAIL-induced apoptotic death. This is an important observation, especially since the study by Peddaboina et al. revealed that Mcl-1 is commonly over-expressed in CRC [47]. Most significantly, we found that down-regulation of Mcl-1 sensitizes CRC cells to TRAIL-induced apoptosis. In conclusion, we present evidence that NVP-AUY922, which directly or indirectly inhibits upstream signals of Mcl-1, may become a likely candidate when treating Mcl-1 over-expressing CRC with therapeutic agents is considered.
Previous studies showed that inhibition of the JAK2-STAT3 pathway by sorafenib (multikinase inhibitor) and natural compounds synergistically enhances TRAIL-induced apoptosis of cancer cells [48]. This is probably due to the inhibition of STAT3-mediated Mcl-1 expression [49]. To examine whether similar synergistic effects could be observed in HCT116 cells expressing JAK2-WT or JAK2-V617F, we treated these cells with NVP-AUY922 and then added TRAIL. We found that combination NVP-AUY922 and TRAIL treatment significantly reduces apoptosis induction in both JAK2-WT and JAK2-V617F expressing cells compared to empty vector (EV) transfected cells (Fig. 6B). These data indicate that inactivation of the JAK2/STAT3 pathway may play a critical role in inhibition of Mcl-1 expression by combined treatment with NVP-AUY922 and TRAIL.
Current treatment trends for inoperable or recurrent CRC favor continuous chemotherapy with or without targeting drugs until the disease progresses. Thus intractable drug toxicity and resistance are major treatment obstacles. Several studies have reported that NVP-AUY922 can induce apoptosis through reduction of anti-apoptotic proteins and increase in pro-apoptotic proteins [26,27]. In the present study, we show for the first time that sublethal doses of NVP-AUY922 effectively sensitize TRAIL-induced apoptosis in a variety of CRC cell lines. This finding provides initial evidence regarding the potential effectiveness, with minimal toxicity to normal tissues, of TRAIL plus low-dose NVP-AUY922 for the treatment of patients with metastatic CRC. In addition, our findings show that JAK2 inactivation is an initial event during NVP-AUY922 mediated augmentation of or NVP-AUY922-mediated sensitization to TRAIL-induced apoptosis.
Highlights.
-
►
NVP-AUY922 promotes TRAIL cytotoxicity in colorectal cancer cells.
-
►
NVP-AUY922 decrease the expression level of anti-apoptotic protein Mcl-1.
-
►
The IL-6-JAK2-STAT3 signal transduction pathway activates Mcl-1 expression.
ACKNOWLEDGMENTS
This work was supported by the following grants: NCI grant R01CA140554 (Y.J.L.) and the Basic Science Research Program of the National Research Foundation of Korea funded by the Ministry of Science, ICT and Future Planning: NRF-2013R1A2A2A01014170 (Y.T.K.). This project used the UPCI Core Facility and was supported in part by award P30CA047904.
Abbreviations used in this paper
- PARP-1
poly (ADP-ribose) polymerase-1
- PBS
phosphate-buffered saline solution
- PI
propidium iodide
- RPMI
Roswell Park Memorial Institute medium
- SDS
sodium dodecyl sulfate
- PAGE
polyacrylamide gel electrophoresis
- TNF
tumor necrosis factor
- TRAIL
tumor necrosis factor-related apoptosis-inducing ligand
- WT
wild-type
Footnotes
Publisher's Disclaimer: This is a PDF file of an unedited manuscript that has been accepted for publication. As a service to our customers we are providing this early version of the manuscript. The manuscript will undergo copyediting, typesetting, and review of the resulting proof before it is published in its final citable form. Please note that during the production process errors may be discovered which could affect the content, and all legal disclaimers that apply to the journal pertain.
Conflict-of-interest disclosure: The authors declare no competing financial interests.
References
- [1].Acheson AG, Scholefield JH. British journal of cancer. 2008;99(Suppl 1):S33–34. doi: 10.1038/sj.bjc.6604580. [DOI] [PMC free article] [PubMed] [Google Scholar]
- [2].Miura K, Satoh M, Kinouchi M, Yamamoto K, Hasegawa Y, Philchenkov A, Kakugawa Y, Fujiya T. Expert opinion on drug discovery. 2014;9:1087–1101. doi: 10.1517/17460441.2014.924923. [DOI] [PubMed] [Google Scholar]
- [3].Ashkenazi A, Pai RC, Fong S, Leung S, Lawrence DA, Marsters SA, Blackie C, Chang L, McMurtrey AE, Hebert A, DeForge L, Koumenis IL, Lewis D, Harris L, Bussiere J, Koeppen H, Shahrokh Z, Schwall RH. The Journal of clinical investigation. 1999;104:155–162. doi: 10.1172/JCI6926. [DOI] [PMC free article] [PubMed] [Google Scholar]
- [4].Walczak H, Miller RE, Ariail K, Gliniak B, Griffith TS, Kubin M, Chin W, Jones J, Woodward A, Le T, Smith C, Smolak P, Goodwin RG, Rauch CT, Schuh JC, Lynch DH. Nature medicine. 1999;5:157–163. doi: 10.1038/5517. [DOI] [PubMed] [Google Scholar]
- [5].Wiley SR, Schooley K, Smolak PJ, Din WS, Huang CP, Nicholl JK, Sutherland GR, Smith TD, Rauch C, Smith CA, et al. Immunity. 1995;3:673–682. doi: 10.1016/1074-7613(95)90057-8. [DOI] [PubMed] [Google Scholar]
- [6].Marsters SA, Pitti RM, Donahue CJ, Ruppert S, Bauer KD, Ashkenazi A. Current biology: CB. 1996;6:750–752. doi: 10.1016/s0960-9822(09)00456-4. [DOI] [PubMed] [Google Scholar]
- [7].El-Deiry WS. Drug resistance updates: reviews and commentaries in antimicrobial and anticancer chemotherapy. 1999;2:79–80. doi: 10.1054/drup.1999.0075. [DOI] [PubMed] [Google Scholar]
- [8].Galligan L, Longley DB, McEwan M, Wilson TR, McLaughlin K, Johnston PG. Molecular cancer therapeutics. 2005;4:2026–2036. doi: 10.1158/1535-7163.MCT-05-0262. [DOI] [PubMed] [Google Scholar]
- [9].Xu L, Qu X, Zhang Y, Hu X, Yang X, Hou K, Teng Y, Zhang J, Sada K, Liu Y. FEBS letters. 2009;583:943–948. doi: 10.1016/j.febslet.2009.02.014. [DOI] [PubMed] [Google Scholar]
- [10].Lee DH, Kim DW, Jung CH, Lee YJ, Park D. Toxicology and applied pharmacology. 2014;279:253–265. doi: 10.1016/j.taap.2014.06.030. [DOI] [PMC free article] [PubMed] [Google Scholar]
- [11].Lee DH, Kim DW, Lee HC, Lee JH, Lee TH. Biochemical and biophysical research communications. 2014;446:815–821. doi: 10.1016/j.bbrc.2014.01.112. [DOI] [PubMed] [Google Scholar]
- [12].Lee DH, Rhee JG, Lee YJ. British journal of pharmacology. 2009;157:1189–1202. doi: 10.1111/j.1476-5381.2009.00245.x. [DOI] [PMC free article] [PubMed] [Google Scholar]
- [13].Grbovic OM, Basso AD, Sawai A, Ye Q, Friedlander P, Solit D, Rosen N. Proceedings of the National Academy of Sciences of the United States of America. 2006;103:57–62. doi: 10.1073/pnas.0609973103. [DOI] [PMC free article] [PubMed] [Google Scholar]
- [14].Neckers L, Ivy SP. Current opinion in oncology. 2003;15:419–424. doi: 10.1097/00001622-200311000-00003. [DOI] [PubMed] [Google Scholar]
- [15].Kamal A, Thao L, Sensintaffar J, Zhang L, Boehm MF, Fritz LC, Burrows FJ. Nature. 2003;425:407–410. doi: 10.1038/nature01913. [DOI] [PubMed] [Google Scholar]
- [16].Ciocca DR, Clark GM, Tandon AK, Fuqua SA, Welch WJ, McGuire WL. Journal of the National Cancer Institute. 1993;85:570–574. doi: 10.1093/jnci/85.7.570. [DOI] [PubMed] [Google Scholar]
- [17].Cornford PA, Dodson AR, Parsons KF, Desmond AD, Woolfenden A, Fordham M, Neoptolemos JP, Ke Y, Foster CS. Cancer research. 2000;60:7099–7105. [PubMed] [Google Scholar]
- [18].Blagosklonny MV. Journal of the National Cancer Institute. 2001;93:239–240. doi: 10.1093/jnci/93.3.239-a. [DOI] [PubMed] [Google Scholar]
- [19].van de Vijver MJ, He YD, van’t Veer LJ, Dai H, Hart AA, Voskuil DW, Schreiber GJ, Peterse JL, Roberts C, Marton MJ, Parrish M, Atsma D, Witteveen A, Glas A, Delahaye L, van der Velde T, Bartelink H, Rodenhuis S, Rutgers ET, Friend SH, Bernards R. The New England journal of medicine. 2002;347:1999–2009. doi: 10.1056/NEJMoa021967. [DOI] [PubMed] [Google Scholar]
- [20].van ’t Veer LJ, Dai H, van de Vijver MJ, He YD, Hart AA, Mao M, Peterse HL, van der Kooy K, Marton MJ, Witteveen AT, Schreiber GJ, Kerkhoven RM, Roberts C, Linsley PS, Bernards R, Friend SH. Nature. 2002;415:530–536. doi: 10.1038/415530a. [DOI] [PubMed] [Google Scholar]
- [21].Picard D. Cellular and molecular life sciences: CMLS. 2002;59:1640–1648. doi: 10.1007/PL00012491. [DOI] [PMC free article] [PubMed] [Google Scholar]
- [22].Stebbins CE, Russo AA, Schneider C, Rosen N, Hartl FU, Pavletich NP. Cell. 1997;89:239–250. doi: 10.1016/s0092-8674(00)80203-2. [DOI] [PubMed] [Google Scholar]
- [23].Fukuyo Y, Hunt CR, Horikoshi N. Cancer letters. 2010;290:24–35. doi: 10.1016/j.canlet.2009.07.010. [DOI] [PubMed] [Google Scholar]
- [24].Kitson RR, Chang CH, Xiong R, Williams HE, Davis AL, Lewis W, Dehn DL, Siegel D, Roe SM, Prodromou C, Ross D, Moody CJ. Nature chemistry. 2013;5:307–314. doi: 10.1038/nchem.1596. [DOI] [PMC free article] [PubMed] [Google Scholar]
- [25].Lu X, Xiao L, Wang L, Ruden DM. Biochemical pharmacology. 2012;83:995–1004. doi: 10.1016/j.bcp.2011.11.011. [DOI] [PMC free article] [PubMed] [Google Scholar]
- [26].Eccles SA, Massey A, Raynaud FI, Sharp SY, Box G, Valenti M, Patterson L, de Haven Brandon A, Gowan S, Boxall F, Aherne W, Rowlands M, Hayes A, Martins V, Urban F, Boxall K, Prodromou C, Pearl L, James K, Matthews TP, Cheung KM, Kalusa A, Jones K, McDonald E, Barril X, Brough PA, Cansfield JE, Dymock B, Drysdale MJ, Finch H, Howes R, Hubbard RE, Surgenor A, Webb P, Wood M, Wright L, Workman P. Cancer research. 2008;68:2850–2860. doi: 10.1158/0008-5472.CAN-07-5256. [DOI] [PubMed] [Google Scholar]
- [27].Siegelin MD, Habel A, Gaiser T. Neurobiology of disease. 2009;33:243–249. doi: 10.1016/j.nbd.2008.10.005. [DOI] [PubMed] [Google Scholar]
- [28].Fiskus W, Rao R, Fernandez P, Herger B, Yang Y, Chen J, Kolhe R, Mandawat A, Wang Y, Joshi R, Eaton K, Lee P, Atadja P, Peiper S, Bhalla K. Blood. 2008;112:2896–2905. doi: 10.1182/blood-2007-10-116319. [DOI] [PubMed] [Google Scholar]
- [29].Okui T, Shimo T, Hassan NM, Fukazawa T, Kurio N, Takaoka M, Naomoto Y, Sasaki A. Anticancer research. 2011;31:1197–1204. [PubMed] [Google Scholar]
- [30].Gandhi N, Wild AT, Chettiar ST, Aziz K, Kato Y, Gajula RP, Williams RD, Cades JA, Annadanam A, Song D, Zhang Y, Hales RK, Herman JM, Armour E, DeWeese TL, Schaeffer EM, Tran PT. Cancer biology & therapy. 2013;14:347–356. doi: 10.4161/cbt.23626. [DOI] [PMC free article] [PubMed] [Google Scholar]
- [31].Zitzmann K, Ailer G, Vlotides G, Spoettl G, Maurer J, Goke B, Beuschlein F, Auernhammer CJ. International journal of oncology. 2013;43:1824–1832. doi: 10.3892/ijo.2013.2130. [DOI] [PMC free article] [PubMed] [Google Scholar]
- [32].Paraiso KH, Haarberg HE, Wood E, Rebecca VW, Chen YA, Xiang Y, Ribas A, Lo RS, Weber JS, Sondak VK, John JK, Sarnaik AA, Koomen JM, Smalley KS. Clinical cancer research: an official journal of the American Association for Cancer Research. 2012;18:2502–2514. doi: 10.1158/1078-0432.CCR-11-2612. [DOI] [PMC free article] [PubMed] [Google Scholar]
- [33].Saturno G, Valenti M, De Haven Brandon A, Thomas GV, Eccles S, Clarke PA, Workman P. Oncotarget. 2013;4:1185–1198. doi: 10.18632/oncotarget.1162. [DOI] [PMC free article] [PubMed] [Google Scholar]
- [34].Chaudhary PM, Eby M, Jasmin A, Bookwalter A, Murray J, Hood L. Immunity. 1997;7:821–830. doi: 10.1016/s1074-7613(00)80400-8. [DOI] [PubMed] [Google Scholar]
- [35].Li L, Shaw PE. The Journal of biological chemistry. 2002;277:17397–17405. doi: 10.1074/jbc.M109962200. [DOI] [PubMed] [Google Scholar]
- [36].Walker SR, Nelson EA, Zou L, Chaudhury M, Signoretti S, Richardson A, Frank DA. Molecular cancer research: MCR. 2009;7:966–976. doi: 10.1158/1541-7786.MCR-08-0238. [DOI] [PubMed] [Google Scholar]
- [37].Berishaj M, Gao SP, Ahmed S, Leslie K, Al-Ahmadie H, Gerald WL, Bornmann W, Bromberg JF. Breast cancer research: BCR. 2007;9:R32. doi: 10.1186/bcr1680. [DOI] [PMC free article] [PubMed] [Google Scholar]
- [38].Lai SY, Childs EE, Xi S, Coppelli FM, Gooding WE, Wells A, Ferris RL, Grandis JR. Oncogene. 2005;24:4442–4449. doi: 10.1038/sj.onc.1208635. [DOI] [PubMed] [Google Scholar]
- [39].Dorsch M, Danial NN, Rothman PB, Goff SP. Blood. 1999;94:2676–2685. [PubMed] [Google Scholar]
- [40].Du W, Hong J, Wang YC, Zhang YJ, Wang P, Su WY, Lin YW, Lu R, Zou WP, Xiong H, Fang JY. Journal of cellular and molecular medicine. 2012;16:1878–1888. doi: 10.1111/j.1582-4934.2011.01483.x. [DOI] [PMC free article] [PubMed] [Google Scholar]
- [41].Schneider MR, Hoeflich A, Fischer JR, Wolf E, Sordat B, Lahm H. Cancer letters. 2000;151:31–38. doi: 10.1016/s0304-3835(99)00401-2. [DOI] [PubMed] [Google Scholar]
- [42].Alvarez JV, Greulich H, Sellers WR, Meyerson M, Frank DA. Cancer research. 2006;66:3162–3168. doi: 10.1158/0008-5472.CAN-05-3757. [DOI] [PubMed] [Google Scholar]
- [43].Nilsson CL, Dillon R, Devakumar A, Shi SD, Greig M, Rogers JC, Krastins B, Rosenblatt M, Kilmer G, Major M, Kaboord BJ, Sarracino D, Rezai T, Prakash A, Lopez M, Ji Y, Priebe W, Lang FF, Colman H, Conrad CA. Journal of proteome research. 2010;9:430–443. doi: 10.1021/pr9007927. [DOI] [PubMed] [Google Scholar]
- [44].Giordano C, Vizza D, Panza S, Barone I, Bonofiglio D, Lanzino M, Sisci D, De Amicis F, Fuqua SA, Catalano S, Ando S. Molecular oncology. 2013;7:379–391. doi: 10.1016/j.molonc.2012.11.002. [DOI] [PMC free article] [PubMed] [Google Scholar]
- [45].Xiong H, Zhang ZG, Tian XQ, Sun DF, Liang QC, Zhang YJ, Lu R, Chen YX, Fang JY. Neoplasia. 2008;10:287–297. doi: 10.1593/neo.07971. [DOI] [PMC free article] [PubMed] [Google Scholar]
- [46].Epling-Burnette PK, Liu JH, Catlett-Falcone R, Turkson J, Oshiro M, Kothapalli R, Li Y, Wang JM, Yang-Yen HF, Karras J, Jove R, Loughran TP., Jr. The Journal of clinical investigation. 2001;107:351–362. doi: 10.1172/JCI9940. [DOI] [PMC free article] [PubMed] [Google Scholar]
- [47].Lin Q, Lai R, Chirieac LR, Li C, Thomazy VA, Grammatikakis I, Rassidakis GZ, Zhang W, Fujio Y, Kunisada K, Hamilton SR, Amin HM. The American journal of pathology. 2005;167:969–980. doi: 10.1016/S0002-9440(10)61187-X. [DOI] [PMC free article] [PubMed] [Google Scholar]
- [48].Peddaboina C, Jupiter D, Fletcher S, Yap JL, Rai A, Tobin RP, Jiang W, Rascoe P, Rogers MK, Smythe WR, Cao X. BMC cancer. 2012;12:541. doi: 10.1186/1471-2407-12-541. [DOI] [PMC free article] [PubMed] [Google Scholar]
- [49].Chen W, Wu J, Shi H, Wang Z, Zhang G, Cao Y, Jiang C, Ding Y. BioMed research international. 2014;2014:764981. doi: 10.1155/2014/764981. [DOI] [PMC free article] [PubMed] [Google Scholar]


