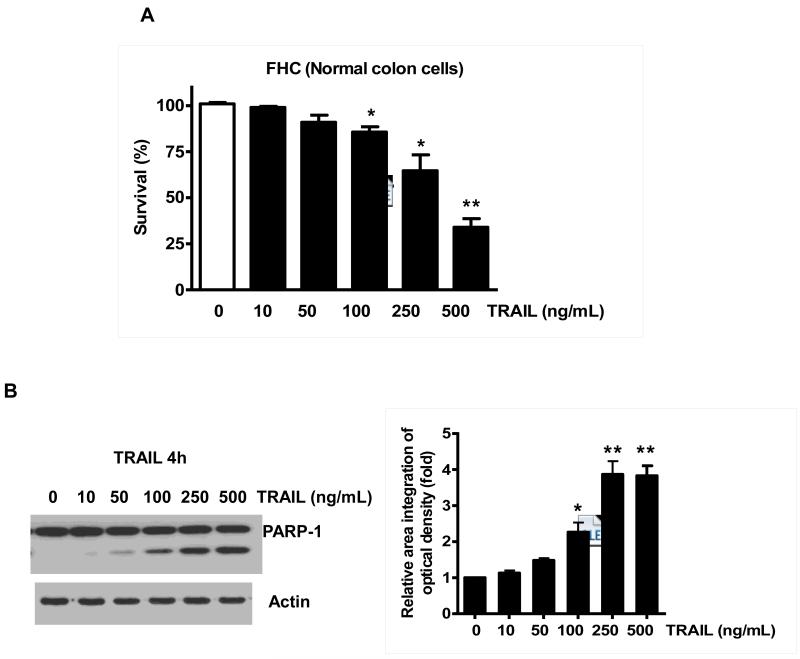
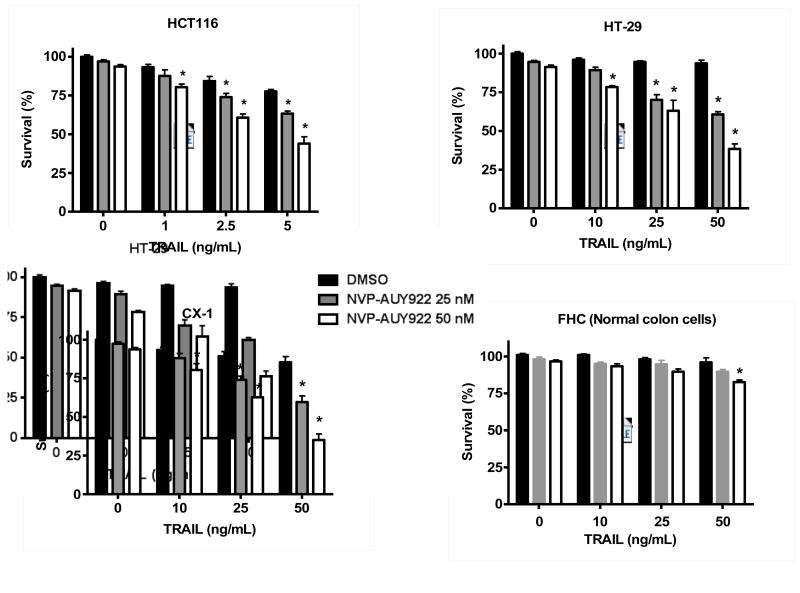
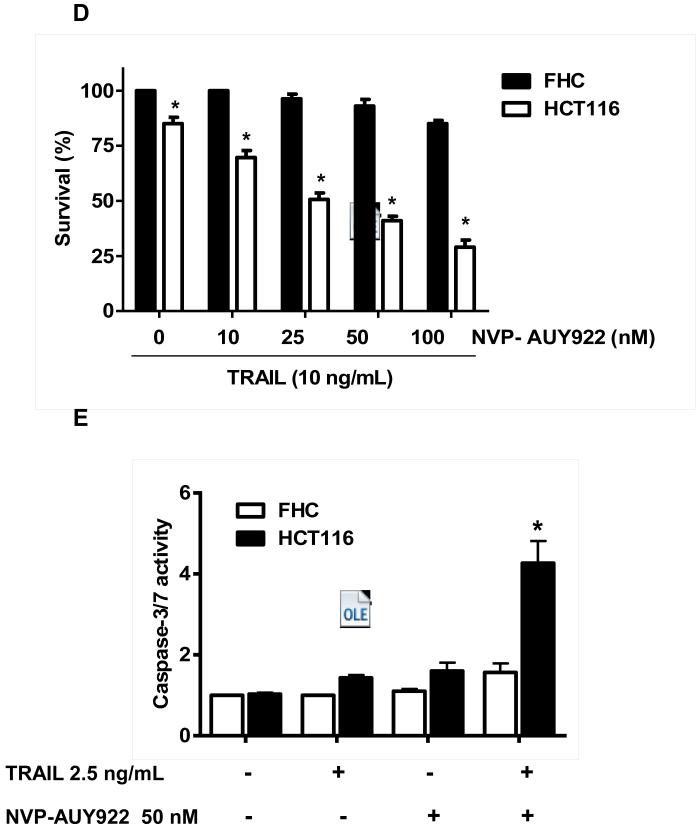
Fig. 2. NVP-AUY922 markedly sensitizes various human colon cancer cells, but not normal colon cells, to TRAIL-induced apoptosis.
(A and B) FHC cells were treated with various concentrations (1-500 ng/ml) of TRAIL for 4 hr. (A) Cytotoxic effect of TRAIL was determined using the MTS assay. Error bars represent standard error of the mean (SEM) from three separate experiments. Asterisk * or ** represents a statistically significant difference between TRAIL treated FTC cells and untreated FTC cells at p<0.05 or p<0.01, respectively. (B) Equal amounts of protein (20 μg) from cell lysates were separated by SDS-PAGE and immunoblotted with anti-PARP-1. Actin was shown as an internal standard. Densitometry analysis of the bands from the cleaved form of PARP-1 was performed (right panel). Error bars represent standard error of the mean (SEM) from three separate experiments. Asterisk * or ** represents a statistically significant difference between TRAIL treated FTC cells and untreated FTC cells at p<0.05 or p<0.01, respectively. (C) Three different human colon cancer cells (HCT116, HT-29 and CX-1) and normal colon FHC cells were untreated or pretreated with NVP-AUY922 for 20 hr and then treated with TRAIL for 4 hr at the indicated concentration. Cellular viability was assessed using MTS assay. Error bars represent standard error of the mean (SEM) from three separate experiments. Asterisk * represents a statistically significant difference between NVP-AUY922 treated cells and untreated cells at p<0.05. (D) HCT116 and FHC cells were treated with various concentrations (0-100 nM) of NVP-AUY922 for 20 hr, and then added TRAIL for 4 hr. Cellular viability was assessed using MTS assay. Error bars represent standard error of the mean (SEM) from three separate experiments. Asterisk * represents a statistically significant difference between FHC cells and HCT116 cells at p<0.05. (E) HCT116 cells treated with 50 nM NVP-AUY922 alone (24 hr), 2.5 ng/ml TRAIL alone (4 hr), or NVP-AUY922 (20 hr) + TRAIL (4 h) for 24 h. Relative caspase activity was determined by the manufacturer’s protocol. Columns indicate average of three individual experiments; bars represents ±SD; *p < 0.05, compared with TRAIL-treated cells.


