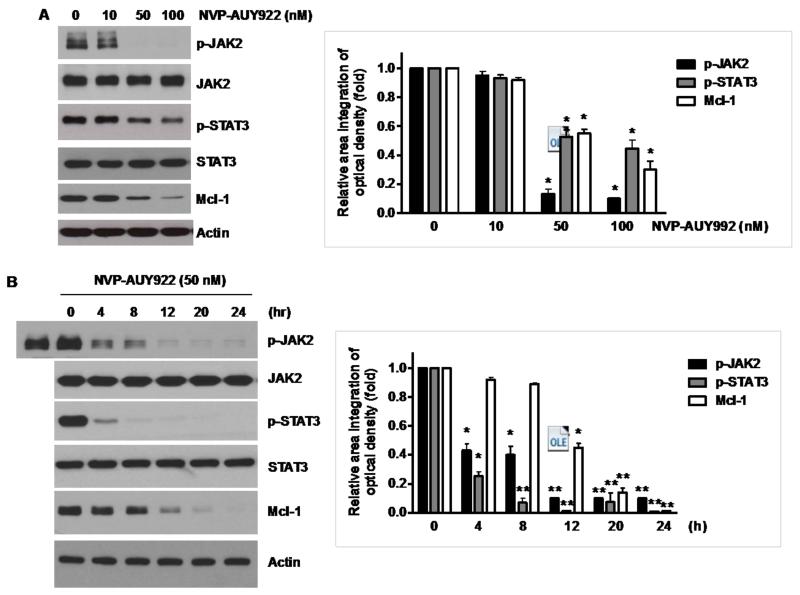
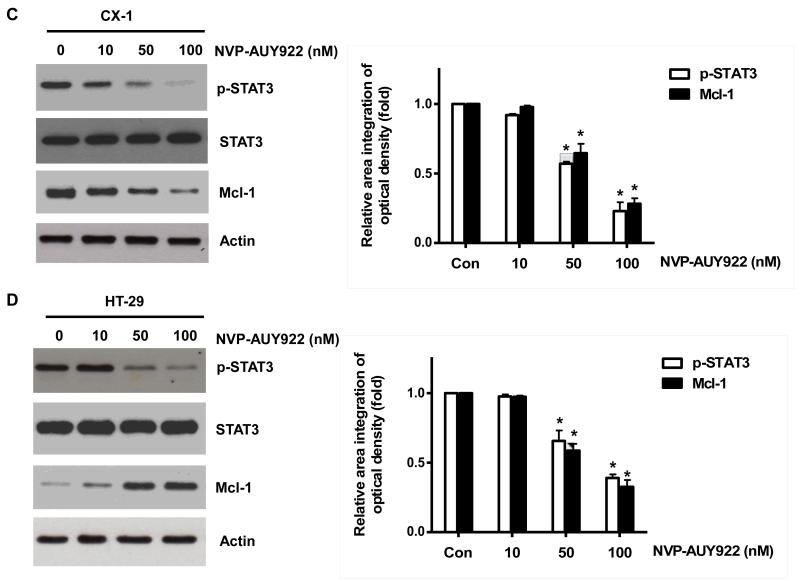
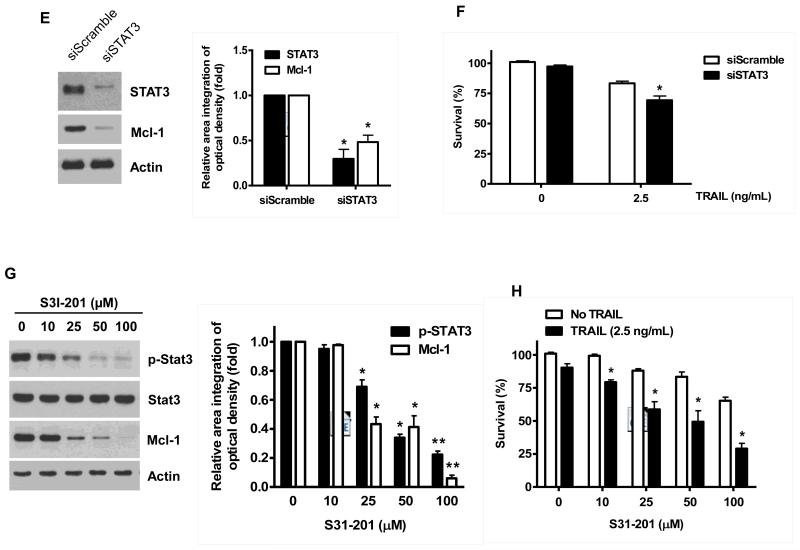
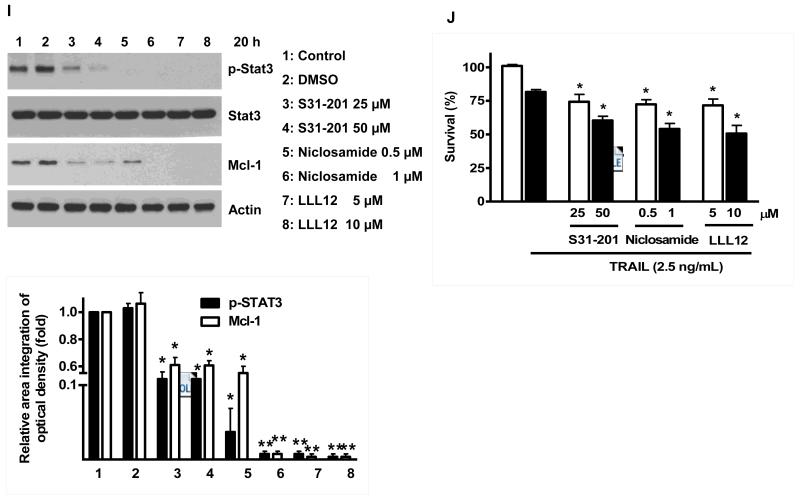
Fig. 5. Effects of NVP-AUY922 on the JAK2-STAT3-Mcl-1 pathway.
(A and B) (A) HCT116 cells were treated with indicated NVP-AUY922 doses (0, 10, 50, 100 nM) for 20 hr. Densitometry analysis of the bands from p-JAK2, p-STAT3 or Mcl-1 was performed (right panel). Error bars represent standard error of the mean (SEM) from three separate experiments. Asterisk * represents a statistically significant difference between NVP-AUY992 treated cells and untreated control cells at p<0.05. (B) HCT116 cells were treated with 50 nM NVP-AUY922 for various times (4-24 hr). Lysates containing equal amounts of protein (20 μg) were separated by SDS-PAGE and immunoblotted with anti-phospho-JAK2, anti-JAK2, anti-phospho-STAT3, anti-STAT3, or anti-Mcl-1 antibody. Actin was shown as an internal standard. Densitometry analysis of the bands from p-JAK2, p-STAT3 or Mcl-1 was performed (right panel). Error bars represent standard error of the mean (SEM) from three separate experiments. Asterisk * represents a statistically significant difference between NVP-AUY992 treated cells and untreated control cells at p<0.05. (C and D) CX-1 and HT-29 cells were treated with indicated NVP-AUY922 doses (0, 10, 50, 100 nM) for 20 hr followed by western blotting using anti-phospho-STAT3, anti-STAT3, or anti-Mcl-1 antibody (left panels). Actin was shown as an internal standard. Densitometry analysis of the bands from p-STAT3 or Mcl-1 was performed (right panels). Error bars represent standard error of the mean (SEM) from three separate experiments. Asterisk * represents a statistically significant difference between NVP-AUY992 treated cells and untreated control cells at p<0.05. (E and F) STAT3 was silenced by STAT3 siRNA in HCT116 cells. The cells were then treated with TRAIL for 4 hr followed by MTS analysis. Densitometry analysis of the bands from STAT3 or Mcl-1 was performed (right panel). Error bars represent standard error of the mean (SEM) from three separate experiments. Asterisk * represents a statistically significant difference between siSTAT3 treated cells and siControl treated cells at p<0.05. (G and H) HCT116 cells were treated with various concentrations of S31-201 (10, 25, 50, 100 μM) for 20 hr, and then added TRAIL for 4 hr. Lysates containing equal amounts of protein were separated by SDS-PAGE and immunoblotted with anti-phospho-STAT3, anti-STAT3, or anti-Mcl-1 antibody. Actin was shown as an internal standard. Three independent experiments were carried out and cellular viability was assessed using an MTS assay. Densitometry analysis of the bands from p-STAT3 or Mcl-1 was performed (right panel). Error bars represent standard error of the mean (SEM) from three separate experiments. Asterisk * or ** represents a statistically significant difference between treated cells and untreated control cells at p<0.05 or p<0.01, respectively. (I and J) HCT116 cells were treated with S31-201 (25, 50 μM), niclosamide (0.5, 1 μM) or LLL12 (5, 10 μM) for 20 hr, and then added TRAIL for 4 hr. Three independent experiments were carried out and cellular viability was assessed using an MTS assay. Densitometry analysis of the bands from p-STAT3 or Mcl-1 was performed (lower panel). Error bars represent standard error of the mean (SEM) from three separate experiments. Asterisk * represents a statistically significant difference between control and drug treated cells at p<0.05.


