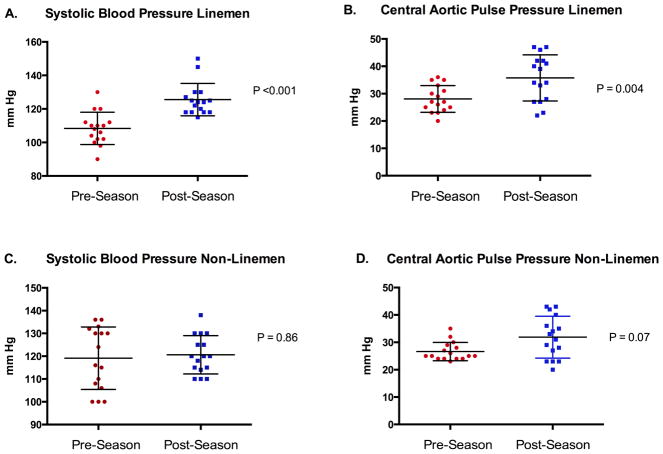
Figure 2. Longitudinal Changes in Systolic Blood Pressure and Central Aortic Pulse Pressure in the Lineman and Non-Lineman Player Cohorts.
Mean ± standard deviation (error bars) lineman systolic blood pressure (Panel A), lineman central aortic pulse pressure (Panel B), non-lineman systolic blood pressure (Panel C), and non-lineman central aortic pulse pressure (Panel D).

