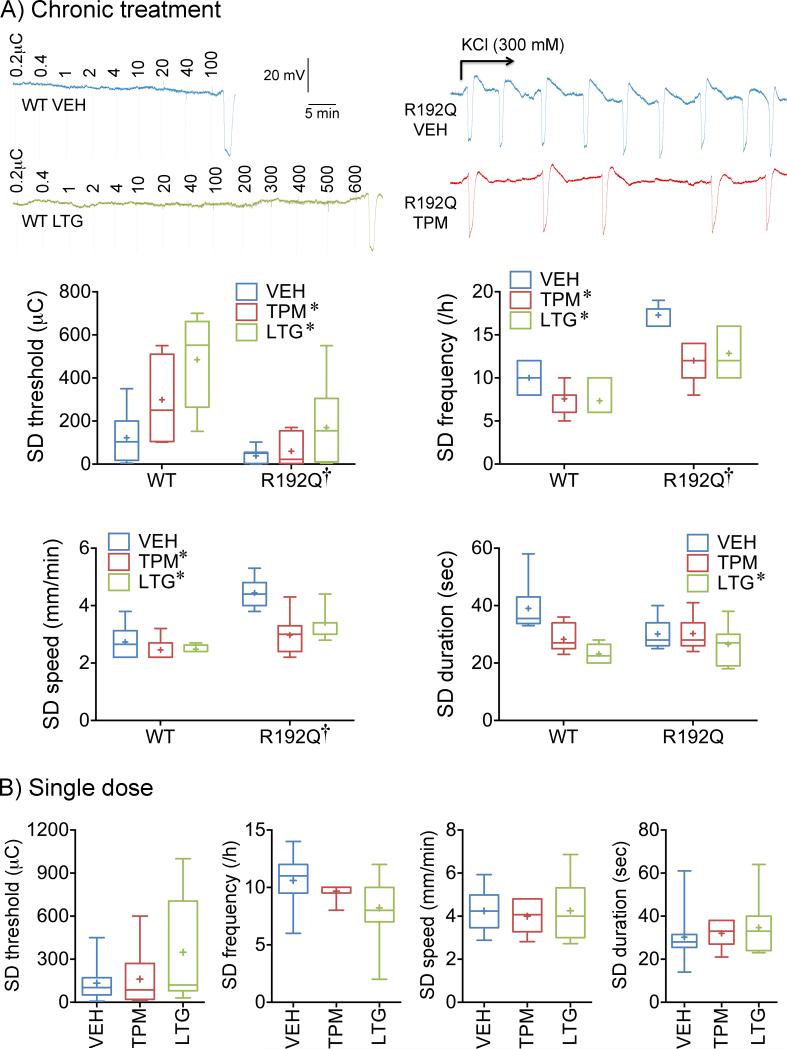
Figure 1. Chronic topiramate and lamotrigine treatment suppresses SD susceptibility.
A) Representative electrophysiological tracings show SD triggered upon stepwise escalating cortical cathodal stimulation at intensities indicated above each tracing to determine the SD threshold (left), and repetitive SDs triggered by continuous topical KCl application for 1h onto the cortex to determine SD frequency (right), in wild-type (WT) or FHM1 (R192Q) mutant mice after 7 weeks of daily treatment with vehicle (VEH, blue), topiramate (TPM, red) or lamotrigine (LTG, green). Whisker-box plots summarize the effects of chronic treatment on SD threshold, frequency, speed and duration. n=6, 7 and 6 WT mice in vehicle, topiramate and lamotrigine groups, respectively; n=7 R192Q mice in vehicle, topiramate, and lamotrigine groups each. Twoway ANOVA followed by Sidak's and Tukey's multiple comparisons. SD threshold: genotype effect F(1,34)=18.8, p=0.0001; treatment effect F(2,34)=8.4, p=0.0011; interaction F(2,34)=1.9, p=0.1674. SD frequency: genotype effect F(1,34)=83.8, p<0.0001; treatment effect F(2,34)=15.4, p<0.0001; interaction F(2,34)=1.8, p=0.1857. SD speed: genotype effect F(1,34)=42.8, p<0.0001; treatment effect F(2,34)=10.7, p=0.0002; interaction F(2,34)=4.8, p=0.0142. SD duration: genotype effect F(1,34)=0.3, p=0.5647; treatment effect F(2,34)=7.8, p=0.0016; interaction F(2,34)=3.8, p=0.0332. Post-hoc comparisons: *p<0.05 vs vehicle; †p<0.05 vs. WT.
B) Whisker-box plots summarize the effect of a single dose of each drug on SD frequency, threshold, speed and duration in WT mice. n=10, 6 and 9 mice in vehicle, topiramate and lamotrigine groups, respectively. One-way ANOVA followed by Holm-Sidak's multiple comparisons test. Treatment effects were not statistically significant.

