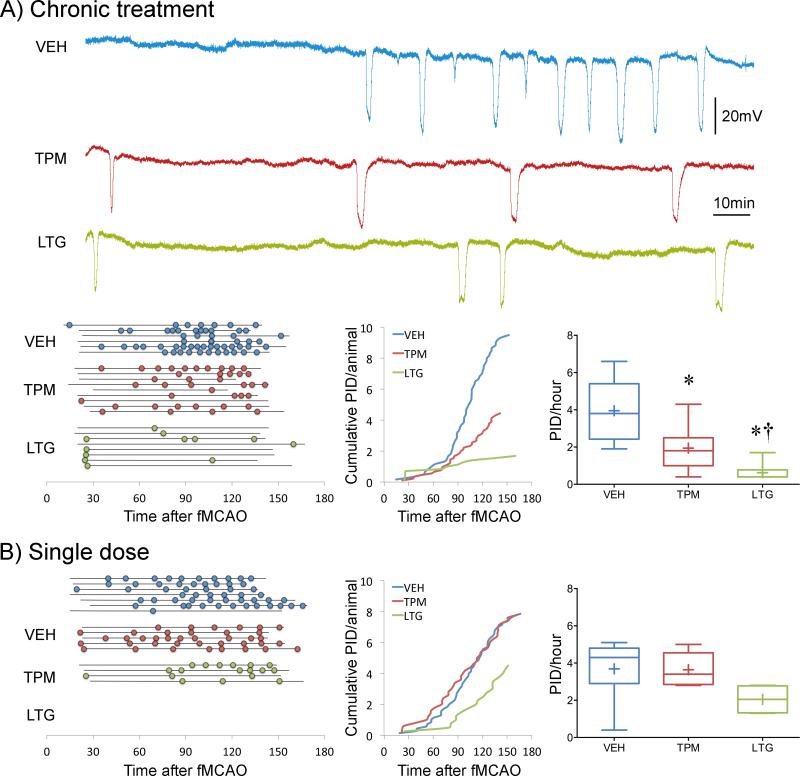
Figure 2. Chronic topiramate and lamotrigine treatment suppresses PIDs.
A) Upper panel shows representative electrophysiological tracings of repetitive PIDs that spontaneously arise around focal ischemic tissue during filament middle cerebral artery occlusion (fMCAO) after 7 weeks of daily treatment with vehicle (VEH, blue), topiramate (TPM, red) or lamotrigine (LTG, green) in WT mice. Lower left panel summarizes all experiments. Horizontal lines indicate the time of onset and end of electrophysiological recordings with respect to fMCAO onset in each mouse, and circles indicate PIDs. Line graph shows average cumulative PID occurrence per mouse as a function of time. When calculating the cumulative PID occurrence over time, differences in group sizes and recording durations were taken into account. Whisker-box plots show average overall PID frequency. n=6, 9 and 8 mice in vehicle, topiramate and lamotrigine groups, respectively. One-way ANOVA followed by Holm-Sidak's multiple comparisons test. Treatment effect F(2,23)=18.1, p<0.0001. Post-hoc comparisons: *p<0.05 vs. VEH; †p<0.05 vs. TPM.
B) Left panel summarizes all experiments where horizontal lines indicate the time of onset and end of electrophysiological recordings with respect to fMCAO onset in each mouse, and circles indicate PIDs. Line graph shows average cumulative PID occurrence per mouse as a function of time. When calculating the cumulative PID occurrence over time, differences in group sizes and recording durations were taken into account and corrected for. Whisker-box plots show average overall PID frequency. n=7, 5 and 4 mice in vehicle, topiramate and lamotrigine groups, respectively. One-way ANOVA followed by Holm-Sidak's multiple comparisons test. Treatment effects were not statistically significant.

