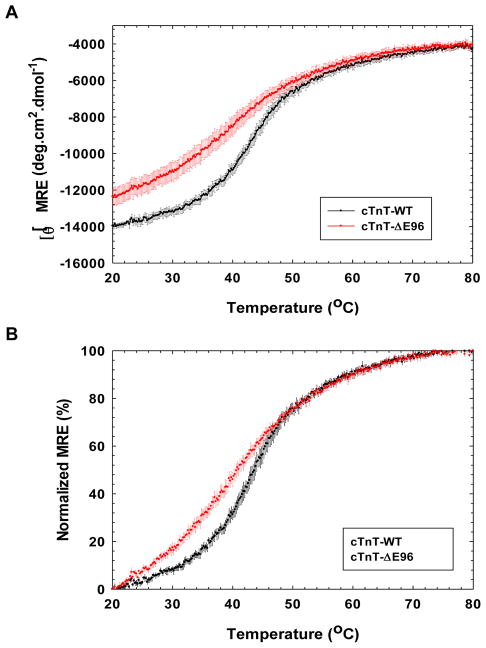
FIGURE 5. Circular Dichroism thermal denaturation curve monitored at a fixed wavelength.
The data was collected at λ=222nm. A) The thermal denaturation curve ([θ]MRE) of the RCM mutant cTnT-ΔE96 mutant versus cTnT-WT. B) Normalized graph of the thermal denaturation curve for the cTnT-ΔE96 RCM mutant versus cTnT-WT. Data are expressed as mean S.E. and n=4 performed for cTnT-WT and cTnT-ΔE96.

