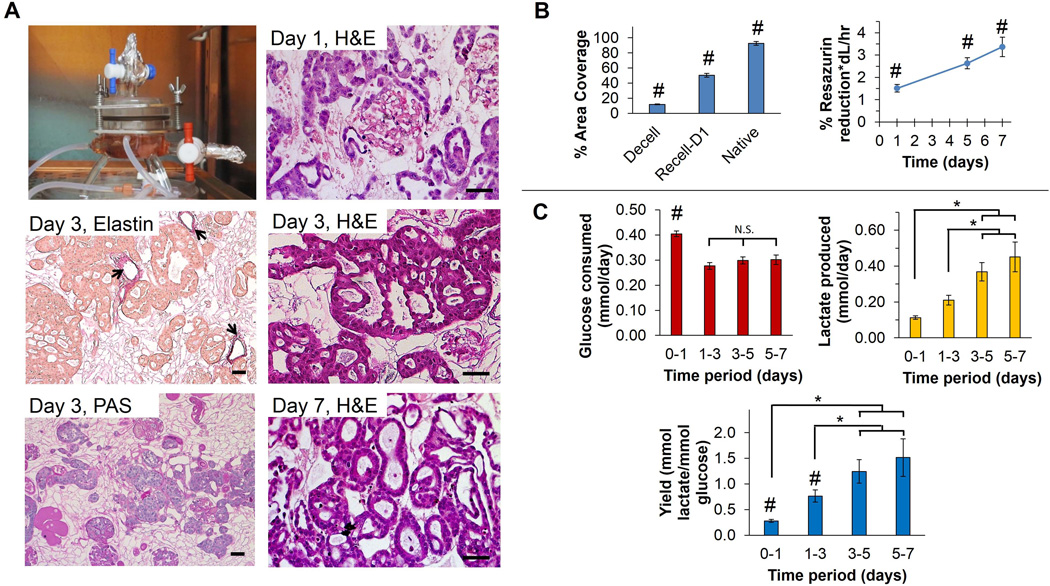
Figure 9. Recellularization of whole-kidney decellularized ECM scaffolds with tubular epithelial cells.
(A) Human RCTE cells were infused into Triton/SDS-decellularized kidneys through the renal artery and cultured within a perfusion bioreactor. Representative images of kidney sections stained with H&E at days 1, 3, and 7, and elastin and PAS at day 3 are shown. Weigert’s resorcin-fuchsin (WRF) staining of elastin demonstrates retention of arteriolar structure and indicates that although RCTE cells were infused through the renal artery they did not remain in this location (arrows depict elastin staining). PAS stain indicates retention of the basement membrane depicted in dark pink, indicating that RCTE cells resided on the basement membrane and formed what appear to be tubular structures. Scale bars: 50 µm. (B) % Area coverage was quantified using ImageJ and decellularized (Decell) and recellularized (Recell-D1) kidneys were compared to native, untreated kidneys. The renal ECM makes up 12.0±0.5% of the total area of decellularized kidneys while normal kidneys have cells and ECM covering 92.7±2.6% with the remaining ~7% taken up by intraluminal (vascular and tubule) open space. Renal cells and adjacent ECM occupied ~50% of the surface area of recellularized kidneys at day 1 as determined in 5 high-powered fields each at 3 separate levels inside the 3D scaffold (15 fields total per kidney). Resazurin reduction assay revealed a significant increase in RCTE metabolic activity over time (p<0.05). (C) Glucose consumption declined after day 1, and remained stable through day 7. Lactate production steadily increased; however, indicating a shift toward glycolytic metabolism. # indicates a significant difference in means compared with all other groups (p<0.05), * indicates a significant difference in means between conditions specified by horizontal and vertical bars (p<0.05), and N.S. indicates no significant difference in means as specified.

