
Figure 1. Pathways that are dispensable for mesenchymal chemotaxis.
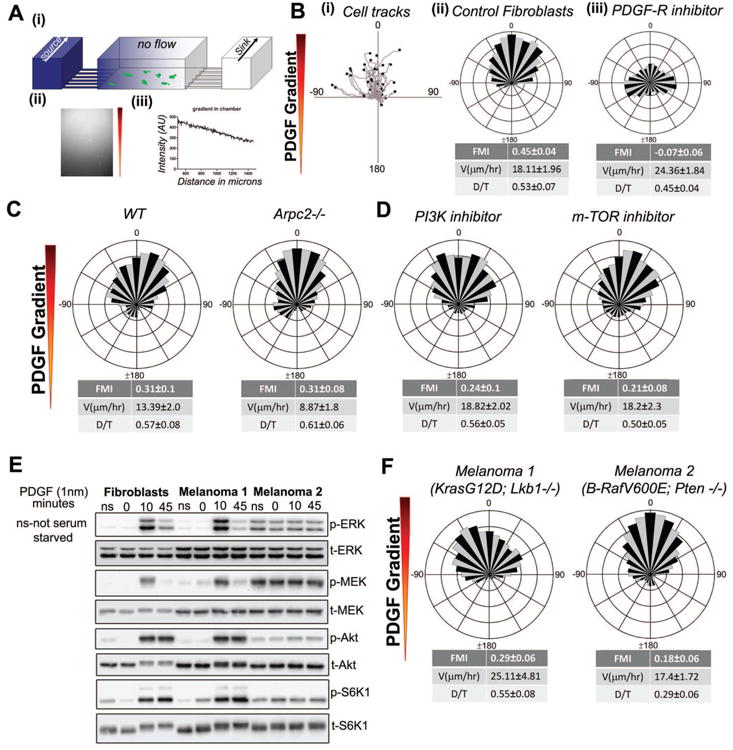
A. (i) A 3D schematic of the microfluidic chamber used for chemotaxis experiments. (ii) The fluorescent micrograph shows the formation of Cy5 dextran gradient in the channel. (iii) A line scan of fluorescent intensity of the gradient indicates that a linear gradient is formed in the chamber with an approximate slope of 43%.
B. (i) Migratory tracks of IA32 fibroblast chemotaxing to a PDGF gradient (ii) Cell tracks of chemotaxing cells represented as a wind-rose plot (number of cell tracked (n) = 62). Each leaflet represents the count frequency of cells migrating in the corresponding angular bin. Forward Migration Index (FMI), persistence (D/T) and velocity values are indicated below the plot, +/- 95% C.I. (iii) Wind-rose plot showing inhibition of chemotaxis to PDGF in the presence of a uniform concentration of PDGF-R inhibitor, AG1296 (1 μM) (n = 68).
C. Wind-rose plots of PDGF chemotaxis of WT (pre-Cre deletion) (n=82) and Arpc2 KO (n = 71) MEFs.
D. Directional migration response of fibroblasts to PDGF gradient in the presence of uniform PI3Kα inhibitor IV (5 μM) (n = 74) or m-TOR inhibitor AZD8055 (1 μM) (n = 56).
E. Western blot analysis of fibroblasts and melanoma cells stimulated with PDGF for the indicated incubation times, ns indicates not serum-starved. Phosphorylation of ERK, MEK, Akt and S6K1 were assessed.
F. Chemotaxis of K-Ras/Lkb1 null (Melanoma 1) (n = 72) and B-Raf/Pten null (Melanoma 2) (n = 81) tumor cell lines to a PDGF gradient.