
Figure 5. PLCγ is essential for PDGF chemotaxis and produces an asymmetric pattern of intracellular DAG.
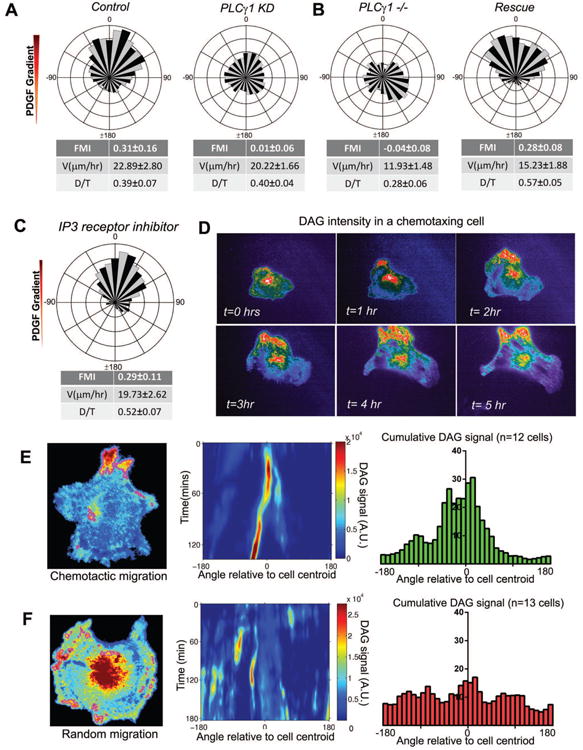
A. Wind-rose plot of control cells migrating in a PDGF (n=67) gradient and loss of directional migration of PLCγ KD cells (n=70) in the same chamber.
B. Fibroblasts derived from PLCγ-null (PLCγ1-/-) (n=73) mice show a loss of chemotactic response to PDGF. Upon rescue of PLCγ expression, these fibroblasts regained their ability to chemotax (n=101).
C. Circular histogram of cells chemotaxing to PDGF gradients in a uniform concentration of Xestospongin-(c) (1 μM) (n=69).
D. Montage of an IA32 fibroblast transfected with GFP-tagged tandem C1 domain [(C1)2-GFP] chemotaxing to PDGF for more than five hours.
E. Enriched pixels in a chemotaxing cell are shown outlined in magenta. The intensity values of the segmented pixels are summed within angular bins at each time point to create a signaling “map” with the angle plotted on the horizontal axis and time on the vertical axis. Histogram showing the cumulative intracellular DAG distribution in chemotaxing cells expressing (C1)2-GFP (n=12 cells).
F. Enriched pixels in a randomly migrating cell are shown outlined in magenta. The intensity values of the segmented pixels are summed within angular bins at each time point to create a signaling “map” with the angle plotted on the horizontal axis and time on the vertical axis. Histogram showing the cumulative intracellular DAG distribution in randomly migrating cells expressing (C1)2-GFP (n=13 cells).