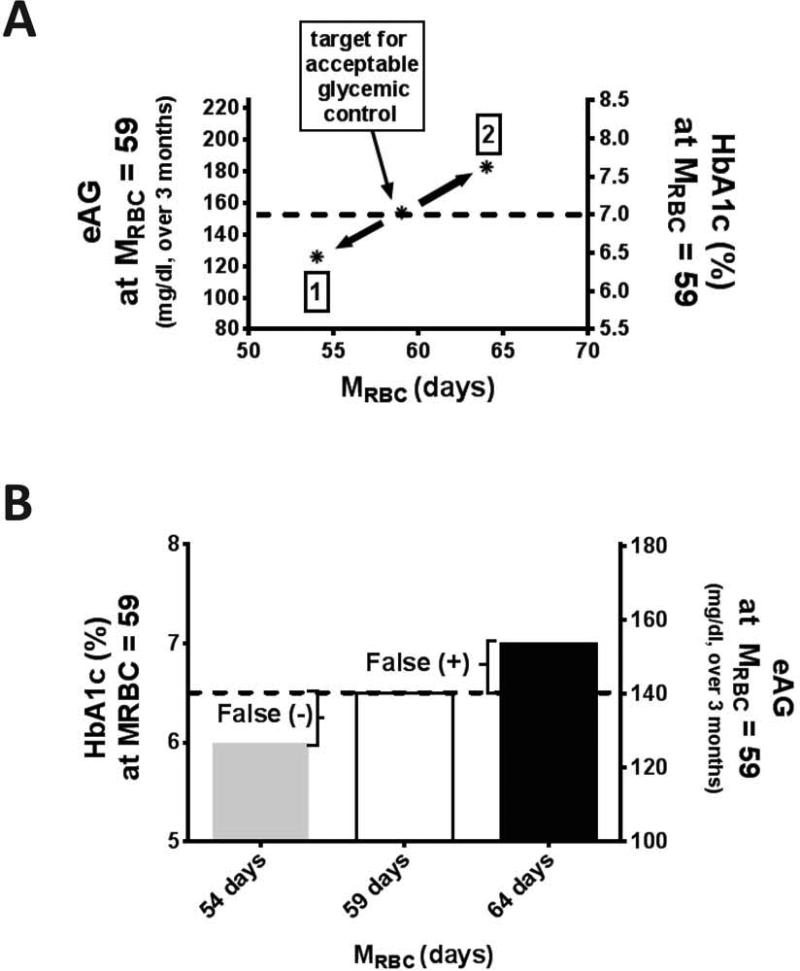
Figure 3.
The impact of RBC life span on HbA1c interpretation. (A) Glycemic control resulting in HbA1c 7.0% at mean red cell survival (MRBC) 59 days would be expected to cause HbA1c as low as ~6.2% (1) or as high a~7.6% (2) in people with diabetes and a range of MRBC 54 to 64 days (±15%, (2SD). The dotted line intersecting the right and left axes represents the estimated average glucose (eAG) and HbA1c respectively at an average MRBC of 59. (B) The impact of accounting for MRBC (15% above and below the average) on HbA1c of 6.5%, the threshold for diabetes diagnosis. Below average and average MRBC would be expected to result in false negatives and false positives in the diagnosis of diabetes. The dotted line intersecting the right and left axes represents the eAG and HbA1c respectively at an average MRBC of 59.

