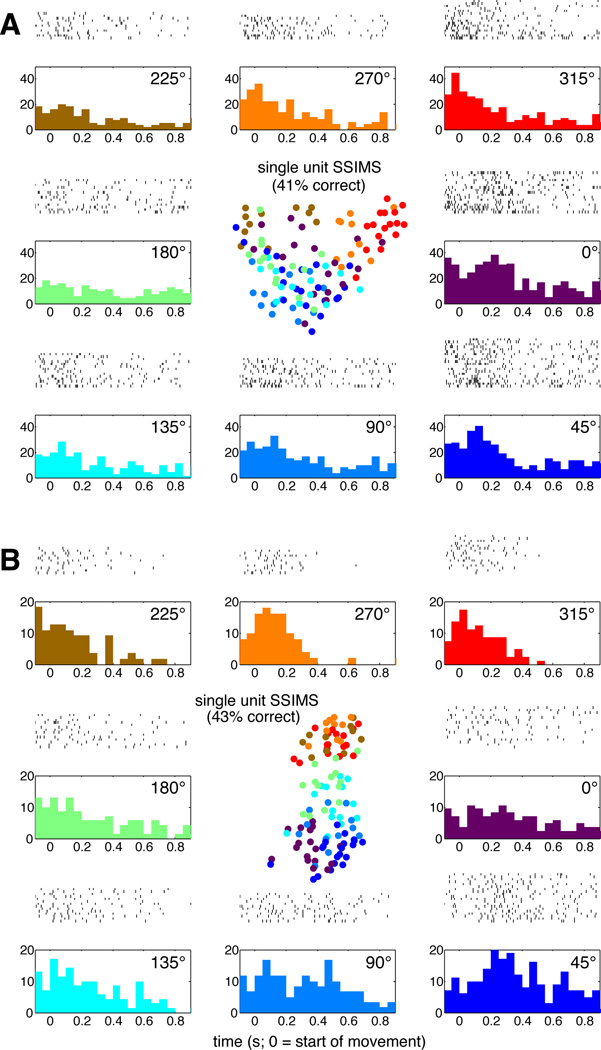
Figure 2. Single neuron SSIMS in the Center-out task.
A. The outer plots show traditional raster-histograms (50 ms bins) for each of the 8 movement directions (radially arranged to represent their relative position on the workspace as shown in Fig. 1). The central plot shows the SSIMS representation for the same data. Each trial shown in the raster plots corresponds to a single point in the SSIMS representation. Color coding is used to match SSIMS points with the corresponding movement directions. A KNN classifier operating on the SSIMS representation of this single unit was capable of correctly predicting the direction of 41% of the trials (see main text for details). B. Similar comparison with a second neuron.

