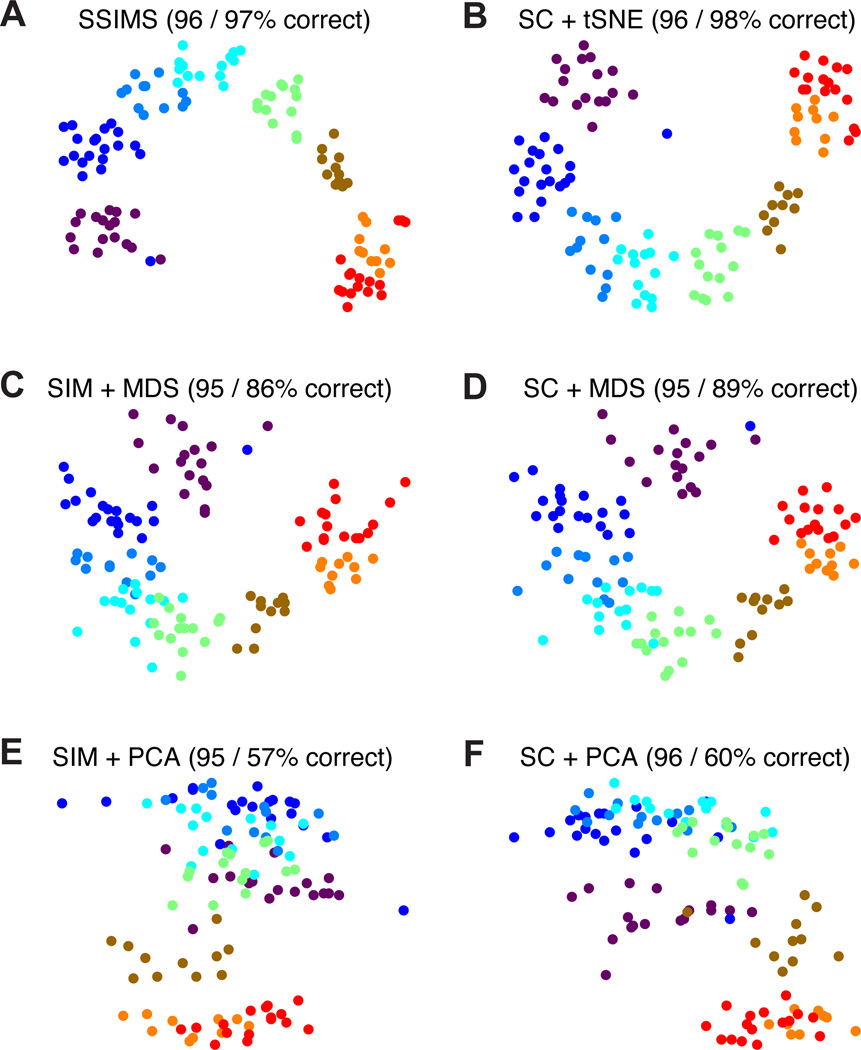
Figure 6. Neural data visualization: COUT task.
Top row shows results using tSNE for the dimensionality reduction step (A,B), middle row represents MDS (C,D) and bottom row PCA (E,F). Left column shows results for methods using spike train similarity as a pre-processing step (A,C,E), right column shows results for methods based on spike counts (B,D,F).

