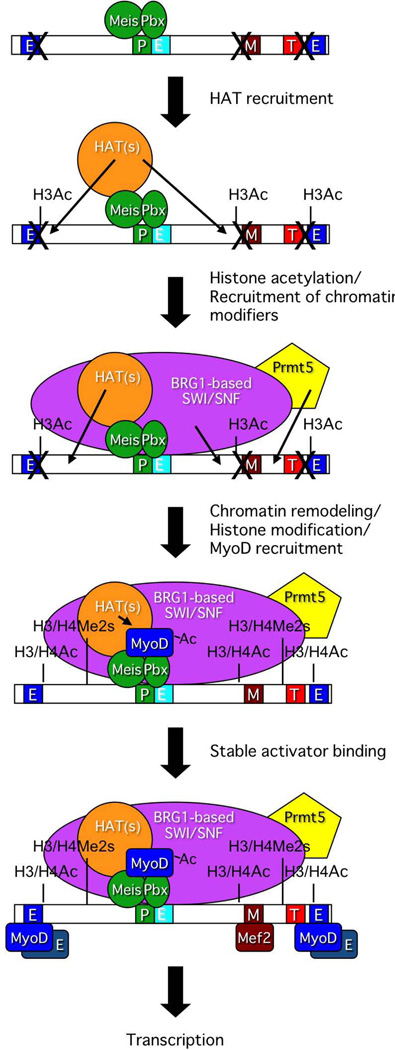
Figure 8.
Proposed model indicating the order of events during activation of the myogenin promoter in mouse embryonic tissue. This schematic diagram is a significantly modified version of the diagram published in Figure 10 of (de la Serna et al., 2005) that was amended with permission from the American Society for Microbiology.

