
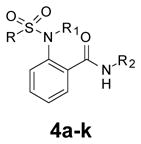
Table 2.
Evaluation of the right-hand phenyl group.
| |||||
|---|---|---|---|---|---|
| Cmpd | R | R1 | R2 | MrgX1 EC50, μMa | Emax (%)a |
| 4a | Me | H |

|
0.531 ± 0.16 | 238 ± 63 |
| 4b | Me | H |

|
3.06± 1.50 | 188 ± 7 |
| 4c | Me | H |

|
0.42 ± 0.33 | 130 ± 28 |
| 4d | Me | H |

|
Inactive | ND |
| 4e | Me | H |

|
1.01± 0.19 | 180 ± 9 |
| 4f | Me | H |

|
2.34± 1.30 | 241 ± 25 |
| 4g | Me | Me |

|
0.50± 0.12 | 184 ± 14 |
| 4h | Me | Me |

|
Inactive | ND |
| 4i | Me | Me |

|
0.55±0.17 | 149 ± 19 |
| 4j | Ph | H |

|
Inactive | ND |
| 4k | Ph | H |

|
Inactive | ND |
a
Assay was run in the presence of 10 nM of BAM8-22; n = 2, N.D.: not determined since Emax is too low.