
Fig. 1.
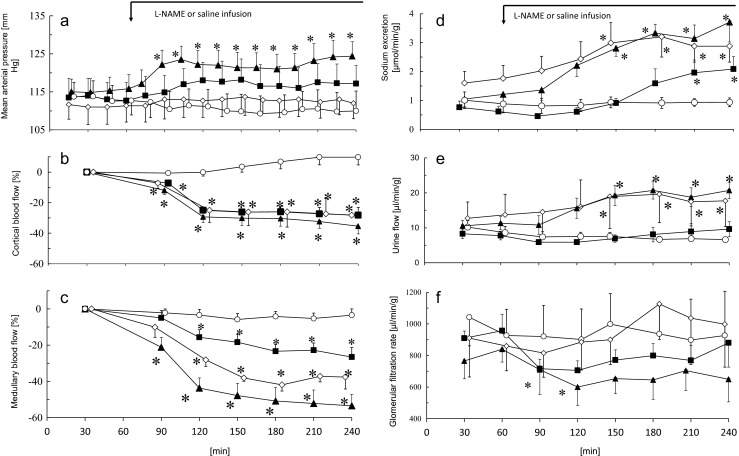
Effects of systemic L-NAME infusion on a mean arterial pressure (AP); b, c renal cortical and medullary blood flow (relative changes), respectively; d sodium excretion; e urine flow and f glomerular filtration rate. Black squares represent the nonpresssor lower dose of L-NAME (5–20 μg/kg/min, n = 5), black triangles the pressor higher dose of L-NAME (50 μg/kg/min of L-NAME, n = 5) and white diamonds the pressor dose of L-NAME with controlled AP (n = 4). White circles indicate the time control group (n = 6). Values are means ± SEM. Asterisks indicate significantly different vs. values before L-NAME at P < 0.05 or less