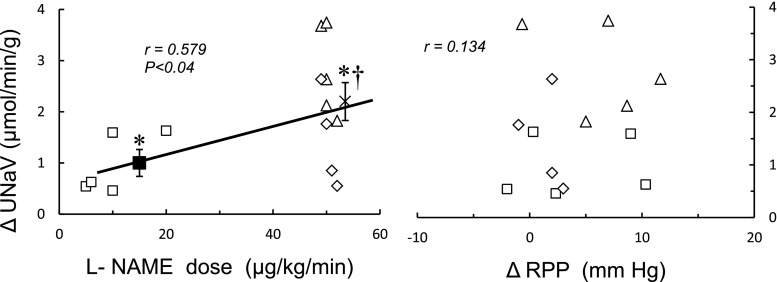
Fig. 2.
Relationships between L-NAME dose (white squares 5–20 μg/kg/min, n = 5; white triangles 50 μg/kg/min with uncontrolled, n = 5; or white diamonds controlled renal perfusion pressure, RPP, n = 4) and changes in urinary sodium excretion, UNaV (left panel) or L-NAME-induced changes in RPP (right panel). X mean value for experiments with L-NAME dose 50 μg/kg/min, asterisks significantly different vs. before L-NAME (P < 0.05 or less), dagger significant difference between mean value for dose 50 μg/kg/min with uncontrolled RPP and mean value for 5–20 μg/kg/min of L-NAME (P < 0.01). There was not a significant correlation between the change in RPP and the change in UNaV (right panel)

