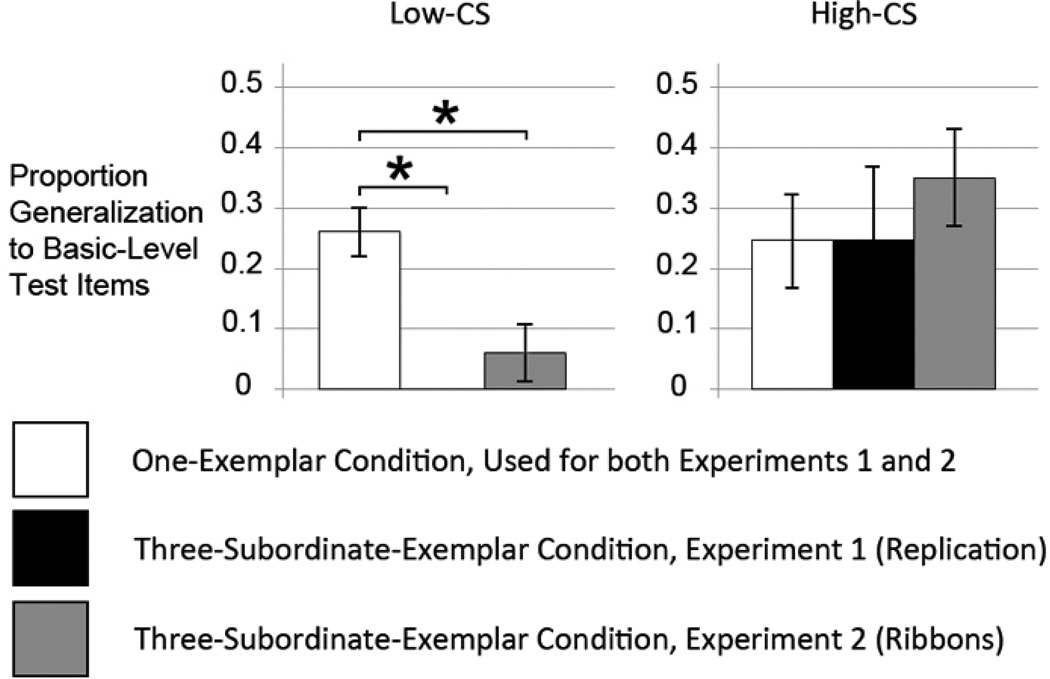
Figure 5.
After performing a median split on CS from Experiment 1, we can see that the low-CS children are driving the entire suspicious coincidence effect previously seen in the overall data (white versus black bars). With the addition of ribbons to exemplars in Experiment 2, the same pattern is seen – low-CS children show a suspicious coincidence effect, but high-CS children show no effect, if anything trending in the opposite direction (white versus gray bars).

