
FIGURE 1.
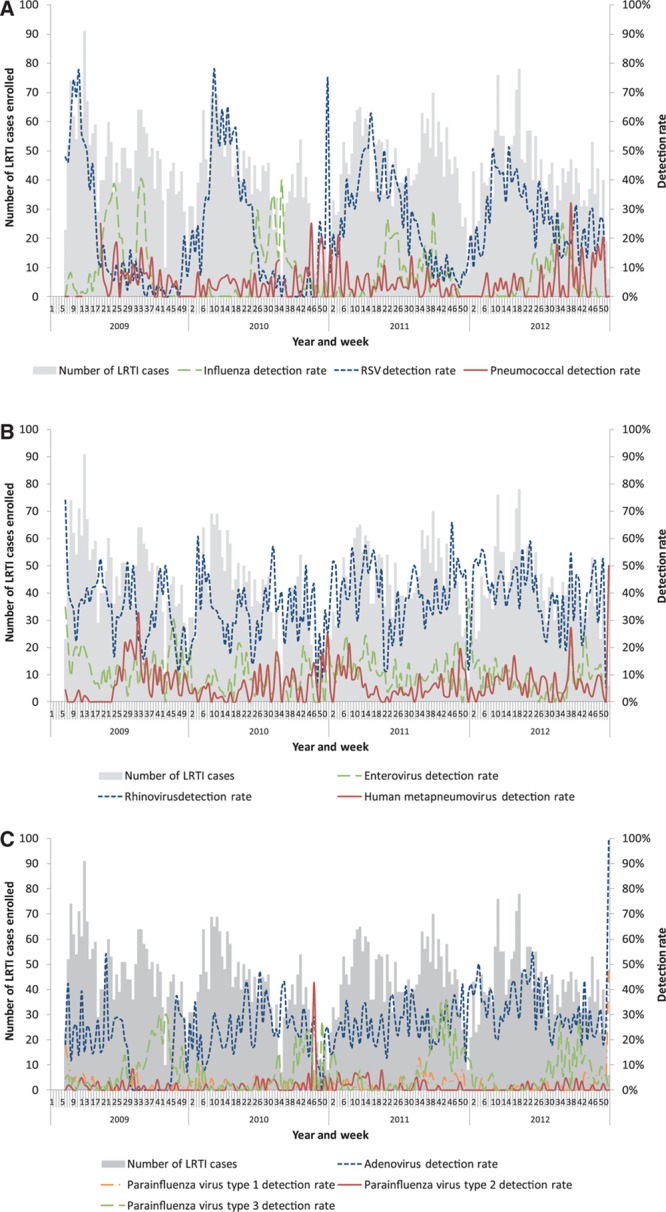
Number of patients enrolled with LRTI and detection rates by epidemiologic week and year at 4 sentinel surveillance sites, South Africa, 2009–2011. (A) Influenza, RSV and pneumococcal detection rates. (B) Enterovirus, rhinovirus and human metapneumovirus detection rates. (C) Adenovirus and parainfluenza virus 1, 2 and 3 detection rates.