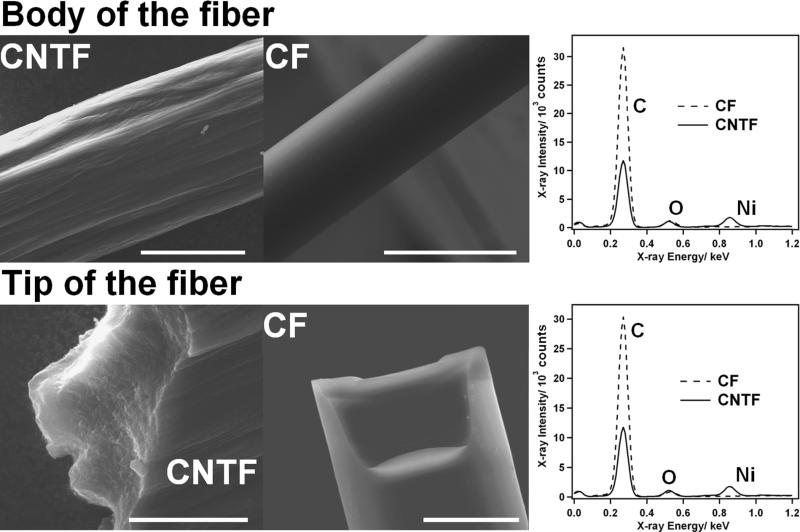
Figure 1.
Characterization of the CNTF and CF: the top row shows SEM images of the body of the CNTF and CF (the bar indicates 50 μm). These images clearly show the irregular surface of the CNTF, composed of several bundles of CNT, in contrast with the smooth surface of the CF. The right panel shows the EDX spectra obtained from the body of the CNTF (solid line) and CF (dotted line). The bottom row shows SEM images of the tip of the CNTF and CF (the bar indicates 20 μm). The native CNTF shows individual CNT protruding at the fracture site. On the opposite, the CF shows a very homogenous structure. The right panel shows the EDX spectra obtained from the tip of the CNTF (solid line) and CF (dotted line).

