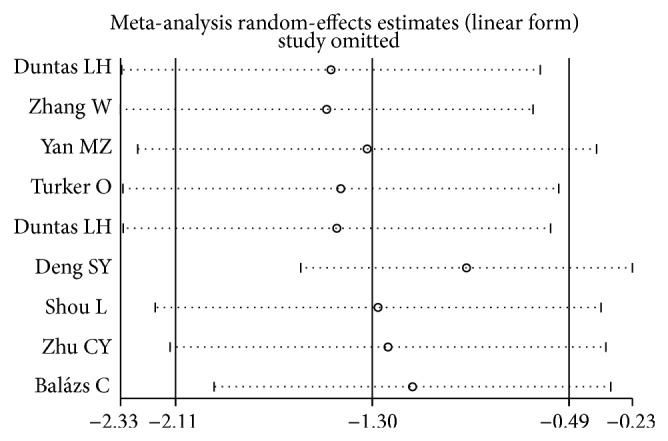
Figure 6.

Sensitivity analysis: examining the influence of individual studies of nine studies (TgAb titers and Se supplementation treatment). This figure shows the influence of each study on the meta-analysis, in which the meta-analysis estimates are computed by omitting one study at a time. By default, random-effects analyses are displayed.
