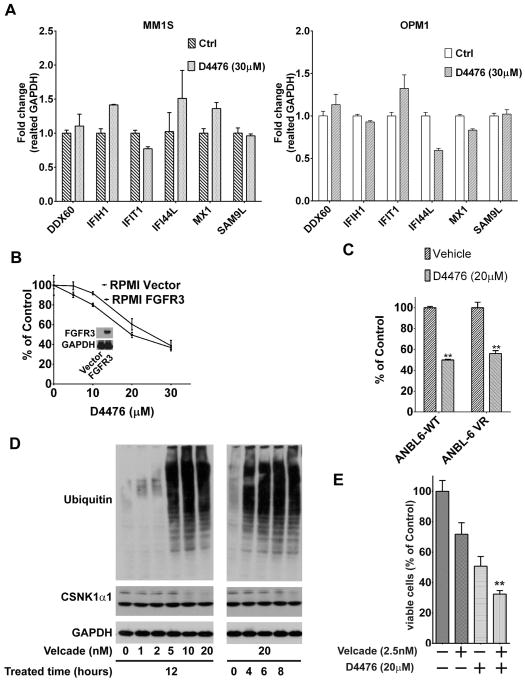
Fig. 4. Gene expression signatures in MM cells with inhibition of CSNK1α1 activity.
(A) RT-PCR shows CSNK1α1 mRNA level changes in RPMI8226 cells transduced with sh3 or 5 relative to control cells (Ctrl). All data represent mean of triplicate experiments. (B) GSEA showed genes in IFNα signature were significantly upregulated and enriched in RPMI8226 cells transduced with shRNA3 and 5. (C) RT-PCR confirmed mRNA level changes of six selected genes in RPMI8226 cells relative to control cells (Ctrl). (D), (E) RT-PCR shows mRNA level changes of selected genes in RPMI82226 or ANBL6 cells exposed to D4476 (30μM for 24h) relative to mRNA level in DMSO only treated cells (Ctrl).

