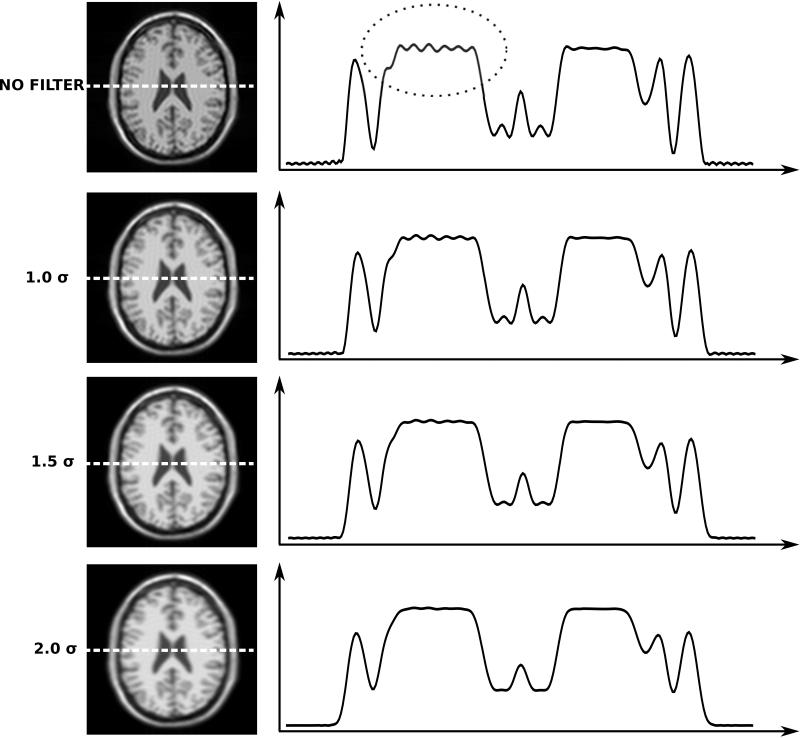
Figure 10.
Illustration of effects of raw data filtering on simulated neuro images. The top row is equivalent to the image in Fig. 4B, which was affected by the point spread function in Fig. 3B. There is considerable Gibbs ringing artifact highlighted by the dotted circle. The three bottom rows represent three different raw filters. The raw filters are all Gaussian shapes where the edge of the window has been set at 1.0, 1.5, and 2.0 times σ. Notice how the filters are progressively better at attenuating the Gibbs ringing albeit at the expense of a broadening of the point spread function.

