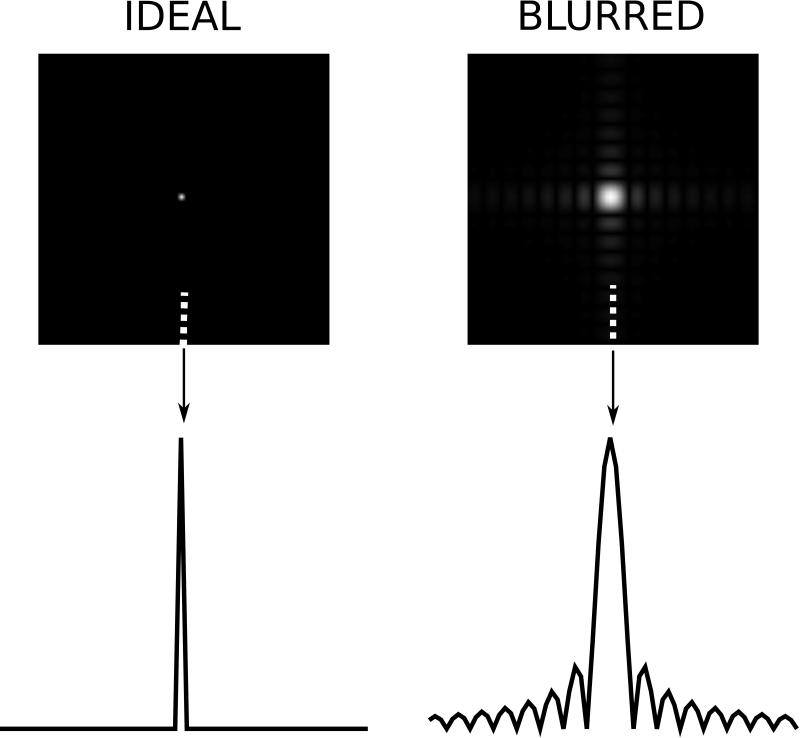
Figure 3.
Illustration of point spread functions. The two images on the top row show reconstruction results of simulated data from a numerical phantom with a single point source of signal. The image on the left shows an idealized scenario where all frequency components of the object are captured and the point source results in a single bright pixel. The image on the right was obtained with a simulated acquisition, which had lower spatial resolution. The lower row shows a plot of a single column of the point spread function for the column indicated by the arrow and dotted line.

