
Table 5.
Comparison of Demographics and Clinical Characteristics between Survivors and Non-Survivors Who Were Admitted (n=4815)
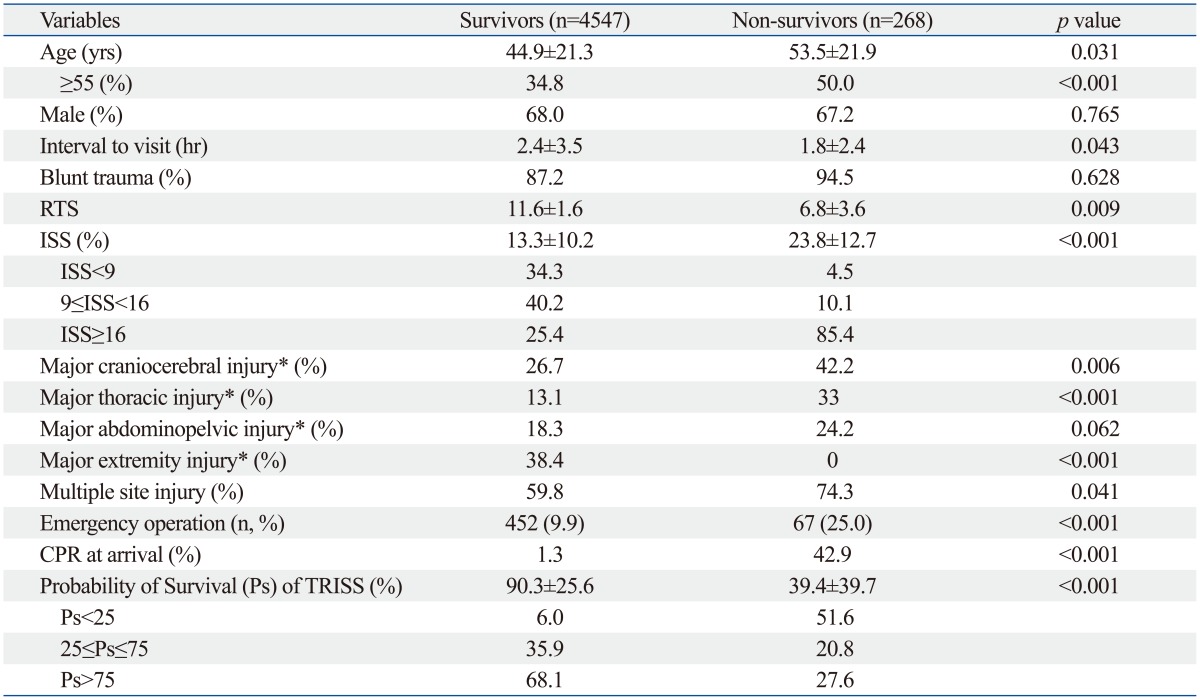
RTS, revised trauma score; ISS, injury severity score; CPR, cardiopulmonary resuscitation; TRISS, trauma and injury severity score; Ps, probability of survival.
Data are presented as the means±SD or numbers (%) of patients.
*Highest area of measured abbreviated injury score that led to death or admission.