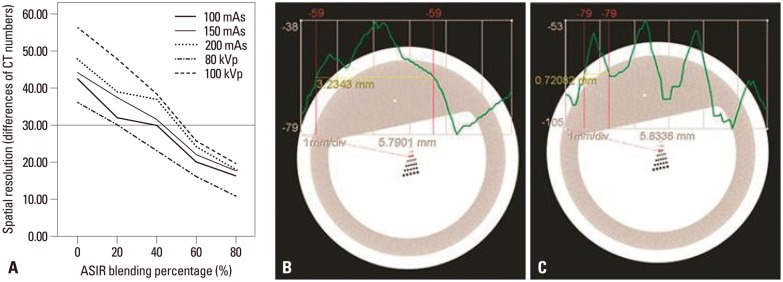
Fig. 4.

Average HU differences between the peaks and valleys are shown according to increasing ASIR percentage. A difference of at least 30 HU needed to be met for optimal quality in terms of spatial resolution (A). Two graphs of the 150-mAs acquisition protocol with ASIR 100% (B) and 40% (C) are shown. HU, Hounsfield unit; ASIR, adaptive statistical iterative reconstruction.
