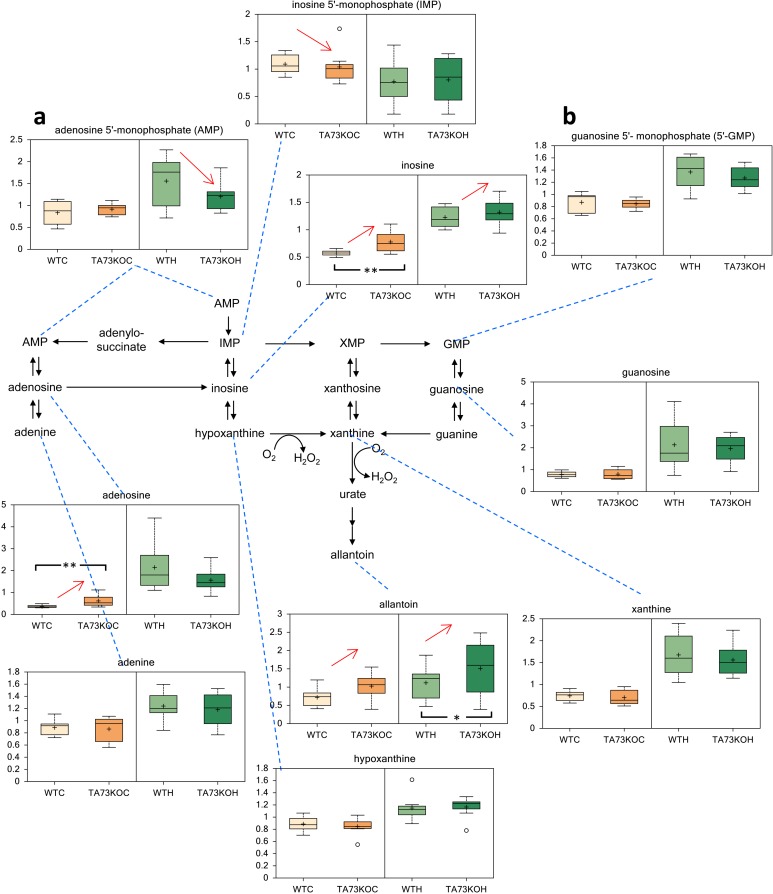
Figure 3. Metabolic Analysis of TAp73 KO mouse Cortex and Hippocampus.
Nucleotide metabolism in TAp73 knockout (TA73KO) versus wild-type (WT) mouse cerebral cortex (C) and hippocampus (H) (n=8 biological littermate replicates; age 1 day). These are the two areas of the central nervous system that show developmental defects in the knockout mice. (a) adenosine 5′-monophosphate (AMP), (b) guanosine 5′-monophosphate (5′-GMP). Box indicates upper/lower quartile, bars max/min of distribution. * p<0.05.

