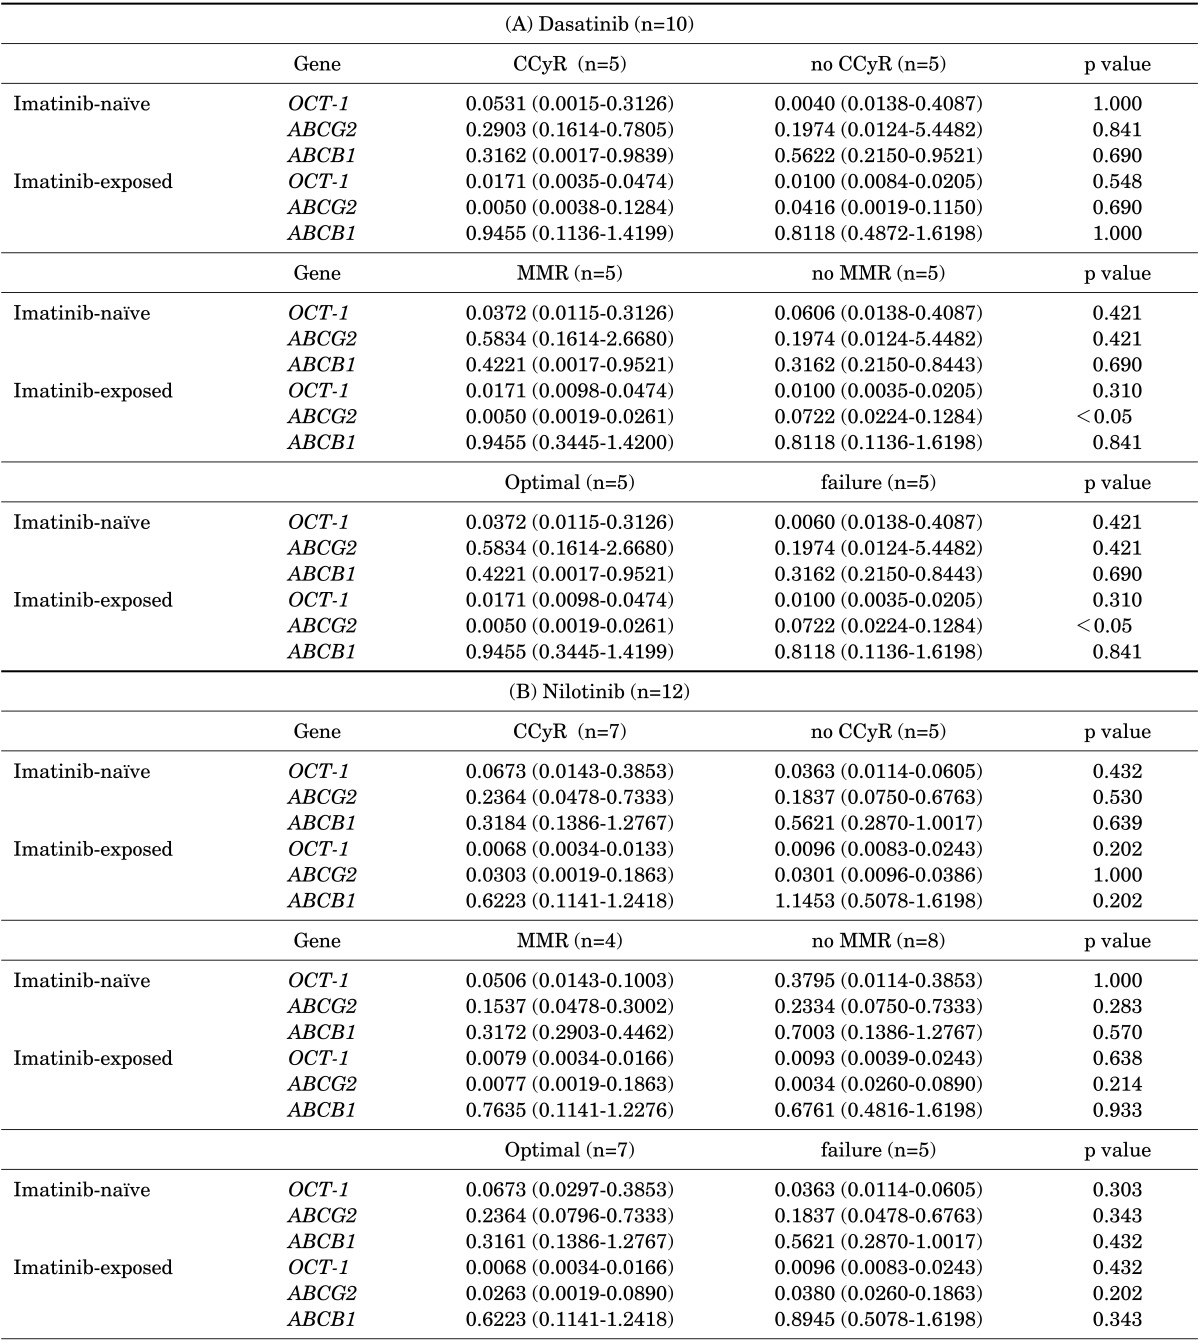
TABLE 3.
mRNA expression of drug transporters according to the treatment outcomes of (A) dasatinib and (B) nilotinib

Each column represents the median (range) of three independent experiments performed in duplicate at each time point. CCyR: complete cytogenetic response, MMR: major molecular response.
