FIGURE 10.
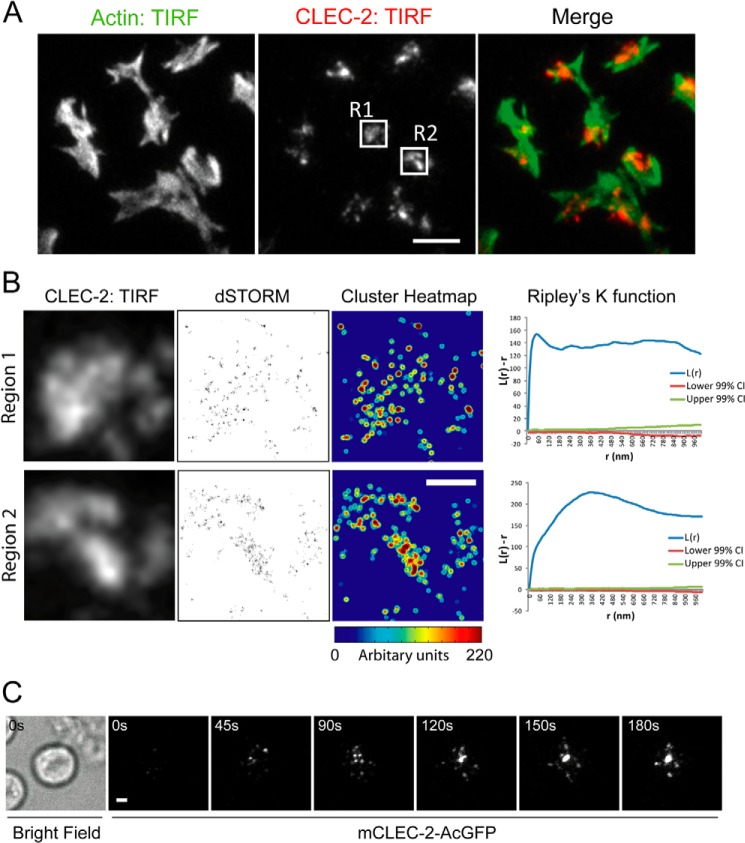
CLEC-2 can form clusters that, following ligand engagement, migrate in a directed manner toward the center of the cell. A, washed mouse platelets were allowed to interact with mPDPN-Fc (10 μg/ml)-coated glass dishes for 45 min at 37 °C. TIRFM image of Alexa 488-phalloidin (left panel) and Alexa 647-anti-CLEC-2 (INU1) (middle panel). The merged images are shown in the right panel (actin, green; mCLEC-2, red). Two regions of interest are highlighted, R1 and R2. Scale bar, 5 μm. B, TIRFM images of Alexa 647-anti-mCLEC-2 in the boxed regions from Fig. 10A (R1 and R2; left panels). dSTORM images of regions 1 and 2 (middle panels). Quantitative cluster mapping of the dSTORM images of regions 1 and 2 (right panels). Scale bar, 1 μm. Ripley's K-function analysis of the molecules in regions 1 and 2; L(r) − r reports the degree of clustering relative to a random distribution (indicated by the lower and upper 99% confidence intervals (CI) (red and green lines)), and r is the radial scale. C, TIRFM time course of a mCLEC-2-AcGFP-expressing DT40 chicken B cell interacting with a planar lipid bilayer containing an CLEC-2-activating antibody (17D9) (see supplemental Movie S3). The bright field image shows the location of the cell. Scale bar, 2 μm. Images are representative of three independent experiments.

