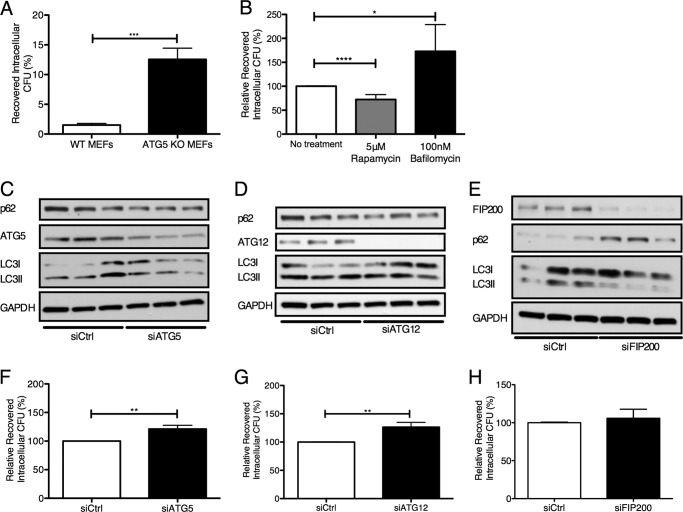
FIGURE 7.
Modulation of autophagy leads to differential GBS intracellular survival. A, recovery of intracellular GBS COH1 within WT and ATG5 KO MEFs following an initial 2-h infection (m.o.i. = 1) and incubation with extracellular antibiotics for 4 h. Invasive bacteria were recovered and are expressed as a percentage of the initial inoculum. B, recovery of intracellular GBS NCTC 10/84 following 1-h infection (m.o.i. = 10) in the presence of rapamycin and bafilomycin A1 at 5 μm and 100 nm, respectively. Recovered bacteria are expressed as a percentage relative to untreated controls. C, D, E, F, G, and H, siRNA knockdown of ATG5, ATG12, and FIP200 in hBMECs was performed as described under “Experimental Procedures.” Western blot analysis was performed in triplicate on hBMEC lysates following COH1 WT infection (m.o.i. = 10) for 4 h plus 1-h incubation with extracellular antibiotics. Recovery of intracellular GBS COH1 WT following 4-h infection (m.o.i. = 10) and treatment with extracellular antibiotics for 1 h in the presence of siATG5, siATG12, and siFIP200 is expressed as a percentage relative to cells treated with siRNA scrambled control (siCtrl). Data are means ± S.E. from three independent experiments performed in triplicate. *, p < 0.05; **, p < 0.005; ***, p < 0.0005; ****, p < 0.0001. Error bars represent S.E.

