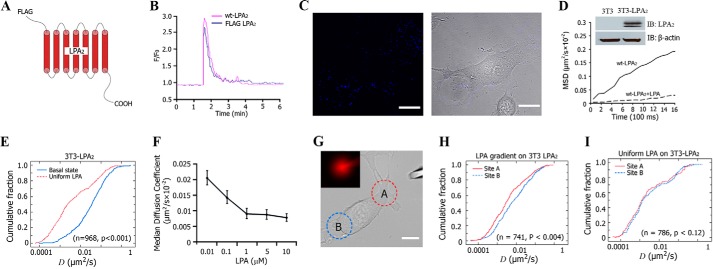
FIGURE 1.
Lateral mobility of LPA2 on the plasma membrane of cells. A, schematic representation of FLAG-tagged LPA2. B, FLAG-LPA2 functioned the same as WT-LPA2 in LPA-induced intracellular Ca2+ mobilization. C, left, fluorescence image of 3T3-LPA2-stable cells labeled with QDs. Right, phase-contrast image. Scale bar, 10 μm. D, MSD versus time plots for FLAG-LPA2 in 3T3-LPA2 cells at basal (without LPA) or LPA (1 μm)-activated state. Plots are averaged from 16–36 individual trajectories. The inset blots show the expression of LPA2 in 3T3-LPA2 cells. E, comparison of cumulative fraction plots from a KS-test of the difference in the diffusion coefficient (D) of LPA2 at the basal state or after exposure to uniform LPA. The respective number of trajectories (n) and p value are listed. F, lateral mobility of LPA2 in response to different concentration of LPA treatment. G, a representative image of a cell exposed to an LPA gradient generated by placing a micropipette releasing LPA (200 nm) in close proximity to a cell. Sites A and B (A and B) are designated relative to the site of micropipette. The inset shows the gradient generated by including fluorescent dextran in the pipette. Scale bar, 10 μm. H, comparison of the cumulative fraction plot from the KS-test of the difference in the diffusion coefficient of LPA2 in site A and site B after exposure to an LPA gradient. The respective number of trajectories (n) and p value are listed. I, comparison of cumulative fraction plot from the KS-test of the difference in the diffusion coefficient of LPA2 in site A and site B after exposure to uniformly distributed LPA. The respective number of trajectories (n) and p value are listed. IB, immunoblot; Error bars, S.E.

