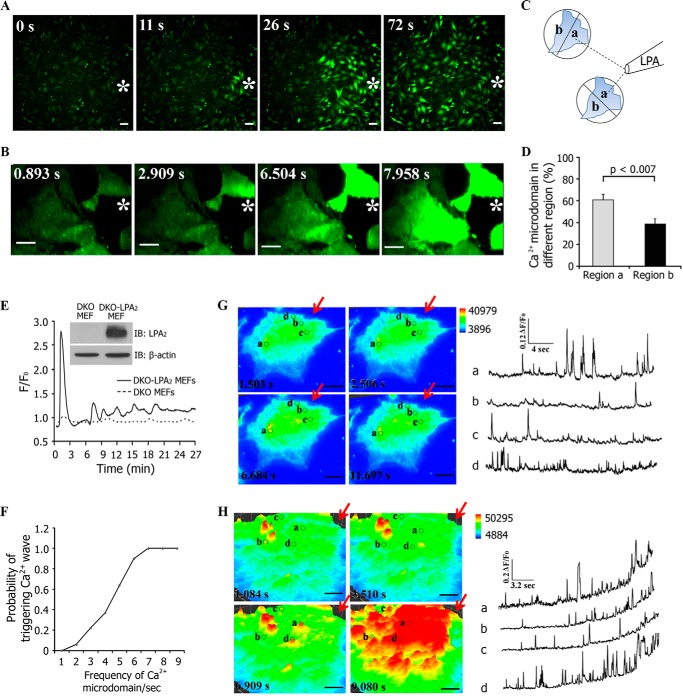
FIGURE 3.
Spatiotemporal patterns of intracellular Ca2+ puffs stimulated by an LPA gradient. A, Fluo-4 AM fluorescence images of [Ca2+]i responses in DKO-LPA2 MEFs exposed to an LPA gradient emitted by a micropipette containing 200 nm LPA. Scale bar, 50 μm. B, TIRF imaging of Fluo-4 AM-stained DKO-LPA2 MEFs exposed to an LPA gradient produced by a micropipette containing 200 nm LPA. Scale bar, 10 μm. White stars, sites of the micropipette. C, schematic showing the method used to define the distribution of the percentage of Ca2+ puffs at the regions exposed to higher LPA concentration (a) and the regions exposed to lower LPA concentration (b) in relation to the site of the micropipette. D, the quantitative analysis of the percentage of Ca2+ puffs localized in regions a and b. Data are presented as mean ± S.E. (error bars). E, LPA gradient-induced differential intracellular Ca2+ mobilization in DKO-LPA2 MEFs, not in DKO MEFs. F, plot showing the probability of triggering a Ca2+ wave by LPA-induced Ca2+ puffs in DKO-LPA2 MEFs (n = 42). G, low frequency Ca2+ puffs (<3 Hz) failed to trigger a Ca2+ wave. Scale bar, 10 μm. H, high frequency Ca2+ puffs (>5 Hz) triggered a Ca2+ wave. Scale bar, 10 μm. In G and H, the circles show the locations of the active Ca2+ puff sites. The Ca2+ signals recorded at marked regions are depicted by the corresponding traces. The amplitude is expressed as F/F0. F is the fluorescence intensity in the marked regions where the spark appeared. F0 is fluorescence intensity of the same area in the absence of Ca2+ puffs. The red arrows indicate the site with the highest LPA concentration. IB, immunoblot.

