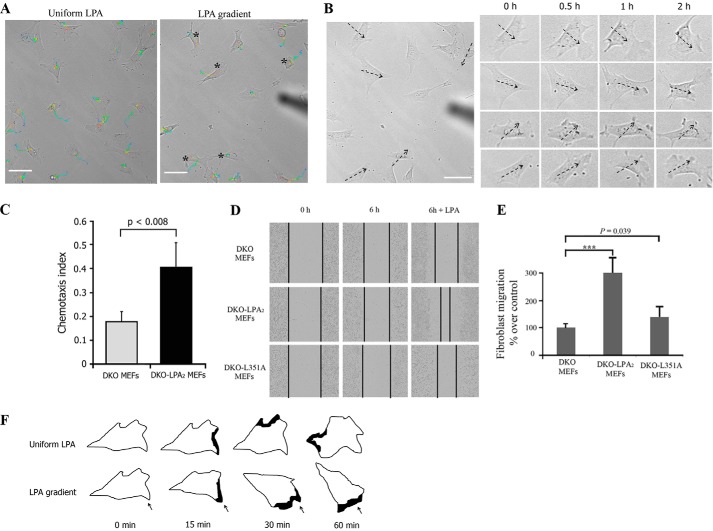
FIGURE 4.
Gradient sensing of fibroblasts stimulated by an LPA gradient. A, representative moving trajectories of DKO-LPA2 MEFs in exposure to an LPA gradient or uniform LPA. The cells were tracked for 1.5 h at a temporal resolution of 1 min/frame. The black stars mark cells significantly migrated toward the LPA gradient. The trajectories are color-coded. Time information is given by the color of the trajectory changing from blue (start) to red (end). The corresponding videos are available as supplemental Videos 4 and 5. Scale bar, 50 μm. B, time lapse images of DKO-LPA2 MEFs stimulated with an LPA gradient. The dashed arrows point to the direction of higher LPA concentration in the gradient. Scale bar, 50 μm. C, chemotaxis index of DKO-LPA2 MEFs or DKO MEFs exposed to an LPA gradient. D, time lapse images of the wound healing assay in DKO, DKO-LPA2, and DKO-L351A MEF monolayers in the presence or absence of 1 μm LPA. E, quantitative analysis of fibroblast migration in a wound healing assay at 6 h postwound in the presence of 1 μm LPA. The data are expressed as the ratios of migratory distance of cells to that of DKO MEFs (mean ± S.E. (error bars), n = 4). F, schematic representations showing the formation of protrusions induced by an LPA gradient. In a gradient of LPA, fibroblasts extend new protrusions toward the LPA gradient. When exposed to uniform LPA, fibroblasts extend new protrusions around the entire perimeter of the cell. The black spot marks the formation of protrusions. The arrow indicates LPA gradient direction.

