FIGURE 7.
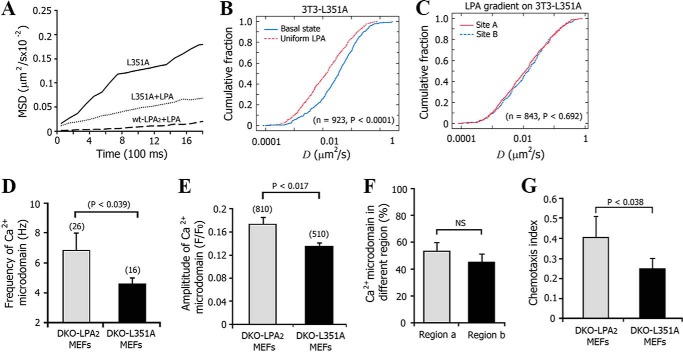
Disruption of the PDZ motif of LPA2 attenuated the LPA gradient-induced spatial decrease in LPA2 mobility. A, MSD versus time plots for LPA2-L351A and WT-LPA2 expressed in 3T3 cells treated with or without 1 μm LPA. B, comparison of cumulative fraction plots from the KS-test of the difference in the diffusion coefficient of lateral L351A at basal and uniform LPA-activated state. The respective number of trajectories (n) and p value are listed. C, KS-test of the difference in the diffusion coefficient of lateral L351A mutant at sites A and B after exposure to an LPA gradient. D, frequency of Ca2+ puffs in DKO LPA2 or DKO-L351A MEFs. The number of cells tested is indicated above each bar. Data are presented as mean ± S.E. (error bars). E, mean amplitude of Ca2+ puffs in DKO-LPA2 or DKO-L351A MEFs. The number of Ca2+ puffs tested is indicated above each bar. F, quantitative analysis of the percentage of Ca2+ puffs localized in region a (close to the micropipette) and region b (away from the micropipette) in DKO-L351A MEFs. Data are presented as mean ± S.E., n = 42. G, chemotaxis index from DKO-L351A MEFs compared with DKO-LPA2 MEFs upon exposure to an LPA gradient.

