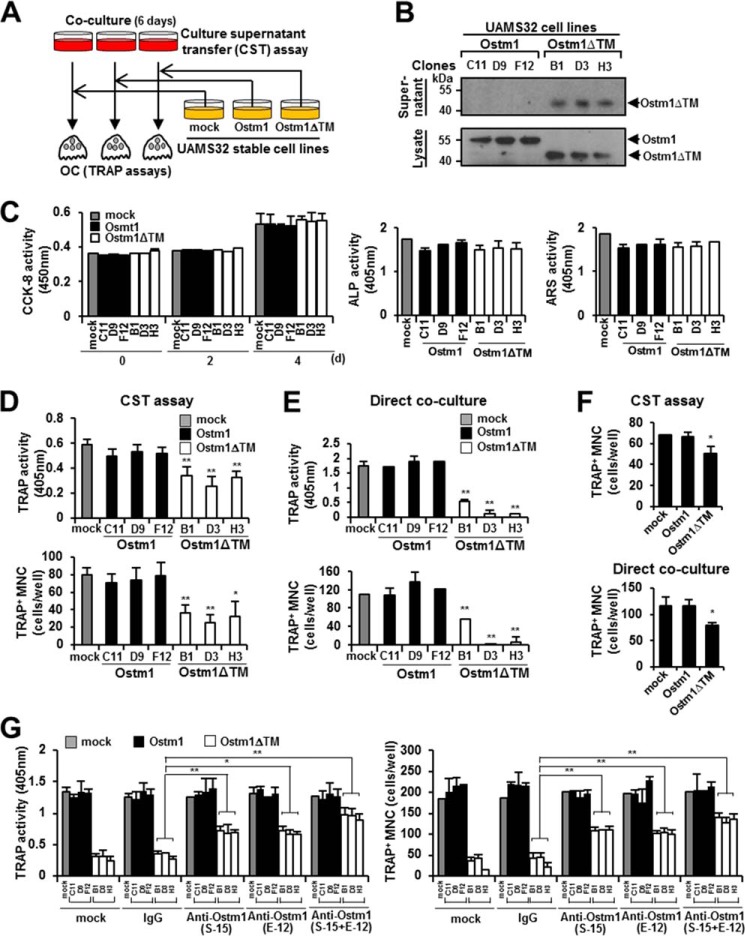
FIGURE 2.
Inhibition of OC differentiation, fusion, and survival by the truncated OSTM1 treatment. A, schematic diagram of the culture supernatant transfer assay. B, extracellular secretion of truncated OSTM1 in UAMS32-stable cell lines. C, effects of truncated OSTM1 on OB proliferation, differentiation, and activation. Shown is a cell proliferation assay of the individual cells of UAMS32-stable cell lines expressing OSTM1 or OSTM1ΔTM (left). UAMS32-stable cell lines were cultured with VtD3 (10−8 m) and PGE2 (10−6 m) for 4 days. Cell viability was measured using the CCK-8 assay. Gray box, mock; black box, OSTM1-stable cell lines; open box, OSTM1ΔTM-stable cell lines. The differentiation of OBs was measured using the alkaline phosphatase assay (middle). The formation of mineralized nodules in OBs was measured using the alizarin red S assay (right). D, inhibitory effects of the truncated OSTM1 derived from UAMS32-stable cell lines in OC differentiation using the culture supernatant transfer assay. E, inhibitory effects of the truncated OSTM1 derived from UAMS32-stable cell lines on OC differentiation detected using a direct co-culture assay. F, inhibitory effects in OC differentiation through culture supernatants derived from KMls-8.3.5.1 cell lines expressing OSTM1ΔTM. The top panel shows results for the culture supernatant transfer assay. The bottom panel shows results for the direct co-culture assay. G, rescue experiment using an OSTM1-neutralizing antibody to assess the inhibitory effect of the truncated OSTM1 on osteoclastogenesis. Anti-OSTM1-neutralizing antibodies (clone E-12 or S-15) or antibody mixtures (E-12 + S-15, 1:1 ratio) were added to the direct co-culture plate with non-adherent BM cells and UAMS32-stable cell lines. The human IgG (IgG) antibody (Sigma-Aldrich) and PBS were used as controls. *, p < 0.05; **, p < 0.01. Error bars, S.D.

