
FIGURE 1.
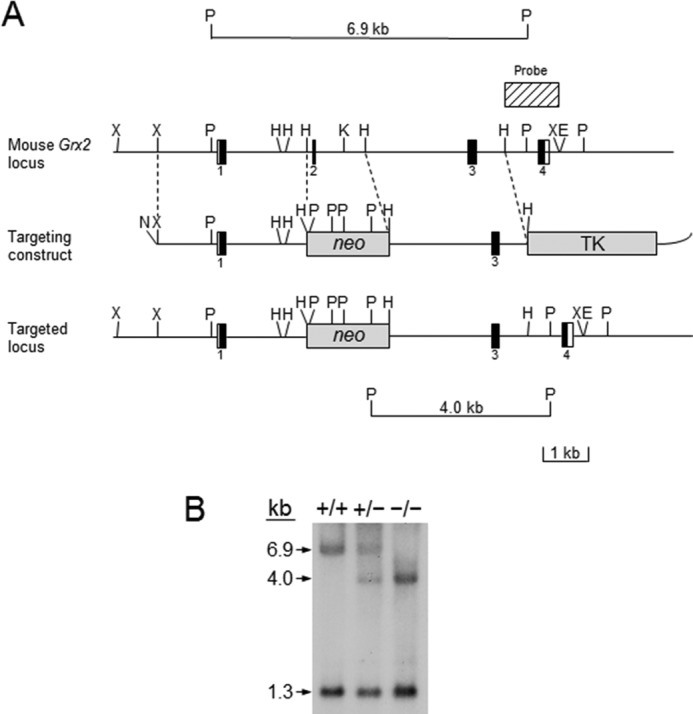
Targeted disruption of the mouse Grx2 gene. A, genomic structure and partial restriction map of the mouse Grx2 locus (top), the targeting vector (middle), and the targeted locus (bottom) are shown. The opened and black boxes represent the protein coding regions and noncoding regions in the exons, respectively. The number of exons is indicated below each exon. The striped box on top of the restriction map of the Grx2 locus represents the 3′ external sequence used for probing the DNA blot filters. B, BamHI; E, EcoRI; H, HindIII; N, NotI; X, XbaI; neo, neomycin resistance cassette; TK, herpes thymidine kinase gene under the control of a mouse promoter of the phosphoglycerate kinase-1 (Pgk-1) gene. Neo, neomycin resistance cassette. The sizes of the PstI restriction fragments from wild-type and targeted loci hybridized with the probe are shown at the top and bottom of the figure, respectively. B, Southern blot analysis of wild-type, heterozygous Grx2 knock-out, and homozygous Grx2 knock-out mice. The 6.9-kb hybridization band is derived from the wild-type Grx2 allele, and 4.0-kb hybridization band the mutated allele. The 1.3-kb hybridization fragment is derived from the PstI genomic fragment containing exon 4 from both the wild-type and the mutated alleles. +/+, +/−, and −/− represent wild-type, heterozygous Grx2 knock-out, and homozygous Grx2 knock-out mice, respectively.