
FIGURE 5.
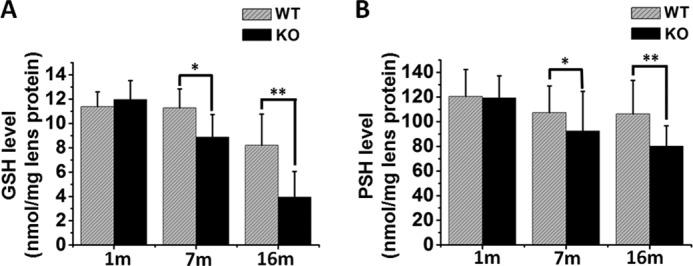
Quantification of free GSH, PSH, in the lenses of WT and Grx2 KO mice. Lenses from Grx2 KO and WT mice (1, 7,and 16 months old) were used for this study. Eight individual lens homogenates were used for the GSH and PSH analysis. A, free GSH levels in Grx2 KO and age-matched WT mice. Data are expressed as means ± S.D., n = 8, *, p < 0.05; **, p < 0.01. B, PSH levels in the lenses of WT and Grx2 KO mice were calculated from the difference between total SH groups and the GSH levels. Data are expressed as means ± S.D., n = 8, *, p < 0.05; **, p < 0.01 versus age-matched WT.