FIGURE 1.
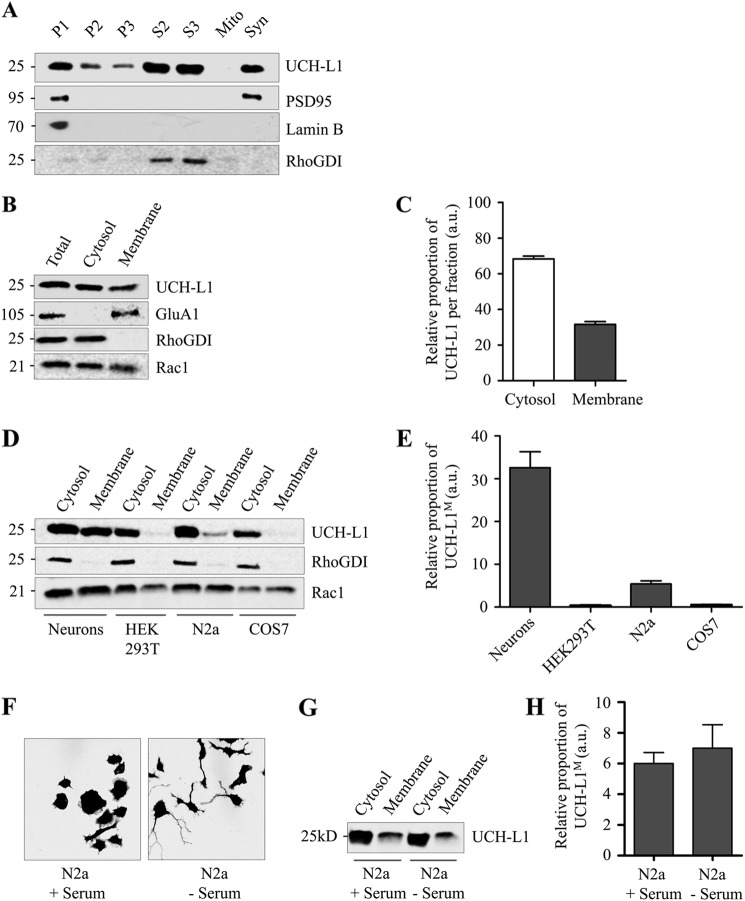
UCH-L1 exists in both cytosolic and membrane-associated forms in neurons. Cell lines contain much lower levels of membrane-associated UCH-L1 than neurons. A, UCH-L1 exists in cytosolic and membrane-enriched fractions of whole rat brain. Adult male rat brain was homogenized and subjected to subcellular fractionation. Fractions were immunoblotted for protein markers to verify enrichment. 30 μg of protein was loaded in each lane. Numbers shown are in kilodaltons relative to molecular weight standards. P1, nuclear-enriched fraction; P2, crude membranes and synaptosomes; P3, microsomes, including the endoplasmic reticulum and Golgi; S2, cytosol and microsomes; S3, cytosol; Mito, mitochondria; Syn, synaptosomes. B, UCH-L1 exists in cytosolic and membrane fractions of cultured cortical neurons. Rat cortical neuronal lysate was subjected to high-speed ultracentrifugation to isolate the soluble cytosolic supernatant and membrane pellet fractions. Protein distribution was tested by immunoblotting for soluble cytosolic protein (RhoGDI) and transmembrane protein (GluA1). A proportion of Rac1 in neurons is peripherally associated with the membrane via geranylgeranylation, and the endogenous distribution is preserved using this protocol. 15 μg of protein was loaded in each lane. C, relative proportions of UCH-L1 detected per microgram of protein in the cytosolic and membrane fractions of cultured cortical neurons. The UCH-L1 signal was quantified using Li-Cor Odyssey imaging software. a.u., arbitrary units. D, cell lines contain much lower levels of UCH-L1M than cultured cortical neurons. Lysates from the indicated clonal cell lines were subjected to high-speed ultracentrifugation to isolate the cytosolic and membrane fractions. Protein distribution was tested by immunoblotting for cytosolic protein (RhoGDI), and prenylated protein (Rac1). The distribution of Rac1 is preserved in cell lines, although the proportions vary between cell lines. UCH-L1 was not detected in the membrane fraction of COS7 or HEK293T cells and only to a minor extent with increased gain in N2a cells. 20 μg of protein was loaded in each lane. E, relative proportions of UCH-L1 detected per microgram of protein in the cytosolic and membrane fractions of the indicated cell lines. The UCH-L1 signal was quantified using Li-Cor Odyssey imaging software. F, serum starvation induces outgrowth of neuronal-like processes in N2a cells. GFP-transfected N2a cells were exposed to serum starvation for 24 h and fixed for confocal microscopy. Cell outlines were identified, and images were prepared using ImageJ software with MacBiophotonics plug-ins. G, differentiation does not alter the proportion of UCH-L1M in N2a cells. Outgrowth of neuronal-like processes was induced in N2a cells with 24-h serum starvation, and then cells were subjected to ultracentrifugation as before. The proportion of UCH-L1M remained unchanged compared with untreated N2a cells. H, relative proportions of UCH-L1M detected per microgram of protein in the membrane fraction of N2a cells. The UCH-L1 signal was quantified using Li-Cor Odyssey imaging software.

