FIGURE 5.
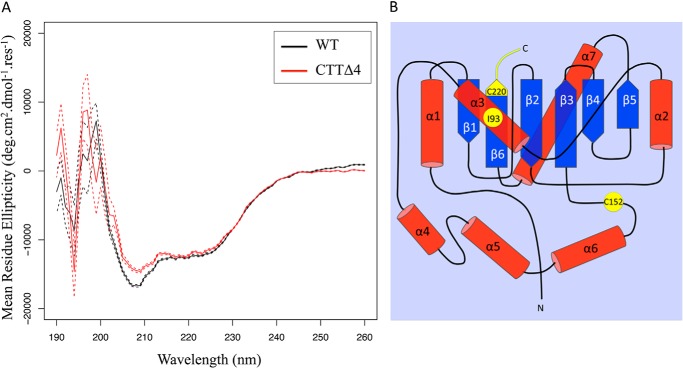
Analysis of the protein structure reveals increased aggregation of CTTΔ4 compared with the WT. A, circular dichroic spectroscopy data show that the CTTΔ4 mutant (red line) has a slightly shallower minimum at 222 nm, indicating that it has a marginally lower α-helical content compared with the WT (black line) at 5 μm protein concentration in PBS with 1 mm TCEP and 0.01% SDS. In each case, the protein is approximately one-third α-helical. There is a dramatic increase in the tendency of the CTTΔ4 mutant to aggregate, as shown by the greatly increased scattering evident in the spectrum, especially at lower wavelengths. Data are presented as mean ± S.E. (WT and CTTΔ4, n = 64). B, topological mapping of residues in UCH-L1 associated with altered protein stability. α-helices are shown in red, and β-strands are shown in blue. Residues reported to correlate with changes in protein stability are shown in yellow.

