
FIGURE 7.
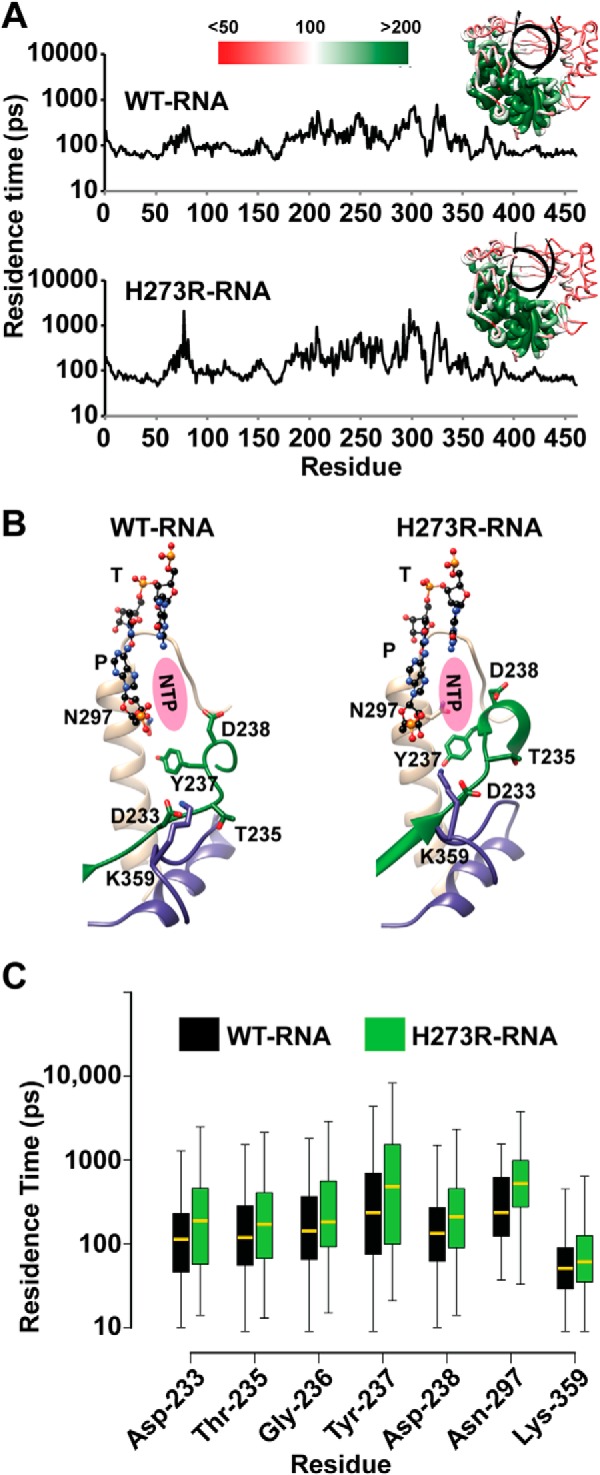
Key active-site residues exhibit reduced flexibility in the H273R RdRp-RNA complex. A, to evaluate increased inflexibility of residues in the H273R RdRp-RNA complex relative to the WT complex, we calculated a parameter that we term “residence time.” Details are provided under “Materials and Methods.” Briefly, the duration of time each Cα atom spends in a predetermined, residue-specific volume is calculated. Inflexible residues will have the longest residence time. Shown is a plot of the average residence time during the MD simulation for each residue of the WT (above) and H273R (below) RdRp-RNA complexes. The insets show the residence times plotted on the structure using the indicated red-to-green scale. The palm subdomain exhibited the least flexibility for both enzymes. B, the plots shown in A were compared for differences. Shown are active-site residues that exhibited reduced flexibility in the H273R RdRp-RNA complex relative to the WT complex. Note that the conformations of these residues also differ with the conformations for the mutator polymerase appearing preorganized for catalysis. C, we compared the plots shown in A using a Wilcoxon rank-sum test. Shown is a box plot of the residence time for the two complexes. The lower and upper ends of the box indicate the cutoff for 25 and 75% of the data, respectively; the lower and upper whiskers extending from the box indicate the minimum and maximum values of the data, respectively. The median residence time is indicated by the yellow line in the box. The p values for the differences, from left to right, were: 0.0009, 0.0409, 0.0456, 0.0549, 0.0004, 0.0200, and 0.00003.